Measured against water
Does milk hydrate you?
Hydrates — holds more fluid than water for about 2-4 hours
Yes, and it is the best-measured example of a drink that beats water in the short term. When 72 men drank a litre of each, skim milk scored 1.58 and whole milk 1.50 on the beverage hydration index against water's 1.00, and both left around a fifth less urine over the four hours that followed. The catch is the window: that is two to four hours in rested, already-hydrated people, not a reason to swap your day's water for milk.1
Last reviewed 24 sourcesWritten from the studies, not from other websites
The measurement
Milk, measured against water
The beverage hydration index is one number: how much urine you produce after a litre of still water, divided by how much you produce after a litre of the test drink, two hours after you finish drinking. Above 1.00 means more of it stayed in you. Orange juice, both milks and the oral rehydration solution all beat water on the raw index; once each drink is corrected for its own water content, only the milks and the oral rehydration solution still clear it.
- Skimmed milk1.58
- Oral rehydration solution1.54
- Full-fat milk1.50
- Orange juice1.39
- Cola1.23
- Diet cola1.08
- Cold black tea1.07
- Hot black tea1.03
- Sports drink1.02
- Still waterreference1.00
- Lager0.99
- Sparkling water0.98
- Coffee (hot, black)0.91
Significance as marked on the paper’s Figure 2: ** P<0.01, * P<0.05 vs waterWhiskers are 1 SD
Show the data tableHide the data table
| Drink | Index2 h | Correctedwater content | SD | vs water | n |
|---|---|---|---|---|---|
| Skimmed milkTesco, 0.1% fat | 1.58 | 1.44 | 0.60 | Above water | 17 |
| Oral rehydration solutionDioralyte, made up with Highland Spring water | 1.54 | 1.50 | 0.74 | Above water | 17 |
| Full-fat milkTesco, 3.6% fat | 1.50 | 1.32 | 0.58 | Above water | 17 |
| Orange juiceTesco Everyday Value | 1.39 | 1.24 | 0.64≈ | Above water | 16 |
| ColaCoca-Cola | 1.23 | 1.09 | 0.54≈ | No detected difference | 17 |
| Diet colaDiet Coke | 1.08 | 1.08 | 0.24≈ | No detected difference | 16 |
| Cold black teaPG tips | 1.07 | 1.07 | 0.59≈ | No detected difference | 17 |
| Hot black teaPG tips | 1.03 | 1.03 | 0.24≈ | No detected difference | 15 |
| Sports drinkPowerade | 1.02 | 0.98 | 0.24≈ | No detected difference | 17 |
| Still waterHighland Spring | 1.00 | 1.00 | — | Reference drink | 72 |
| LagerCarling | 0.99 | 0.94 | 0.31≈ | No detected difference | 17 |
| Sparkling waterHighland Spring | 0.98 | 0.98 | 0.20≈ | No detected difference | 17 |
| Coffee (hot, black)Nescafe Original instant | 0.91 | 0.90 | 0.31≈ | No detected difference | 17 |
≈ marks a standard deviation read from the paper’s figures rather than its text. “Corrected” adjusts each drink for its own water content, which is the fairer comparison and the one that moves orange juice below significance.
What this number is not
- — About 17 drinkers per test drink against a pooled water arm, so small differences such as coffee vs water cannot be detected.
- — Rested, already-hydrated young men drinking 1 L in 30 min; the result describes a 2-4 h window, not all-day hydration.
- — Caffeine at 96-212 mg in these drinks had no effect on net fluid balance. The authors cite a threshold of about 250-300 mg for a measurable diuretic effect (Maughan & Griffin 2003).
- — The lager's alcohol content was not reported, and no numeric 4-h BHI was reported for any drink.
- — Nine of the twelve BHI standard deviations, and eight of the twelve means, are only in the figures; they were read from the figure's vector data and match the text values to about 0.01.
- — The abstract says the BHI was corrected for water content, but the 1.58, 1.54 and 1.50 values are the uncorrected BHI.
Water, coffee, OJ or milk - which one is the best hydrater? - BBC
BBC · starts at 0:44 · Watch on YouTube
Stuart Galloway of the University of Stirling, a co-author of the hydration index study this page is built on, runs a small version of its urine test in a BBC office: six volunteers per drink, a litre of water, orange juice, coffee or semi-skimmed milk, and a pot for every hour. It is a TV demonstration rather than a trial, but he explains plainly why milk holds on to water: its protein slows delivery to the blood, and its sodium and potassium help the body keep it.1
Where the video goes further than the evidence
Nothing loads from YouTube until you press play.
The rest of the evidence
What the other studies found
The index above is one protocol: a litre, at rest, in people who were already hydrated. Most milk research is the opposite situation — dehydrated people replacing what they sweated out — and those retention percentages are a different measurement that must not be read on the same scale. Both sets are below, including the trial that found the opposite of the others.
Shirreffs 20073
After exerciseFluid retainedDifferent protocol11 adults (5 men, 6 women). Dehydrated by 1.8% of body mass with exercise, then drank 150% of the loss (1.79 ± 0.42 L) over 1 h; 4-h recovery.
What each group drank in Shirreffs 2007, and what was measured Waterreference Urine 1205 ± 142 mL; retained 36 ± 10%. Carbohydrate-electrolyte sports drinkPowerade Urine 1184 ± 321 mL; retained 38 ± 16%. Low-fat milk (0.2% fat) Urine 611 ± 207 mL; retained 69 ± 10%; net fluid balance +0.01 ± 0.19 L. Low-fat milk with added sodium chloride Urine 550 ± 141 mL; retained 72 ± 4%; net fluid balance +0.06 ± 0.08 L. After exercise, milk kept people in net positive fluid balance, whereas water and the sports drink did not.
- — Post-exercise, 150% volume: not comparable with BHI values.
- — People with lactose intolerance were excluded.
- — The abstract lists the water and sports-drink urine volumes in reverse order; the Results values are used here.
Seery & Jakeman 20164
After exerciseNet fluid balanceDifferent protocol7 men. About 2% body-mass loss from exercise and heat; drank 150% of the loss at a metered rate over 2-3 h.
What each group drank in Seery & Jakeman 2016, and what was measured Milk Net fluid balance at 5 h +117 (SD 122) mL. Waterreference Net fluid balance at 5 h -539 (SD 390) mL. Carbohydrate-electrolyte drink Net fluid balance at 5 h -381 (SD 460) mL. Overall net fluid balance was higher with milk than with the carbohydrate-electrolyte drink (P=0.001) and water (P=0.006). At the 5-h time point milk beat water (P=0.011), while the comparison with the carbohydrate-electrolyte drink was P=0.077.
- — Abstract only; n=7.
Sayer 20205
After exerciseFluid retainedDifferent protocolNot recorded in the evidence file. Drink volume equal to 100% of sweat loss; water or low-fat milk drunk over 30 or 90 min.
What each group drank in Sayer 2020, and what was measured Water over 30 minreference Retention 57 ± 16%. Water over 90 minreference Retention 60 ± 20%. Low-fat milk over 30 min Retention 83 ± 6%. Low-fat milk over 90 min Retention 85 ± 7%. Low-fat milk was retained more than water at both drinking speeds in the values reported.
- — Abstract only.
Watson 20086
After exerciseNet fluid balanceDifferent protocol7 men. 2.0% body-mass loss in a hot, humid environment; drank 150% of the loss; exercise capacity tested afterwards.
What each group drank in Watson 2008, and what was measured Skimmed milk Net fluid balance +191 ± 162 mL; protein intake 75 ± 8 g on the milk trial. Carbohydrate-electrolyte drink Net fluid balance -135 ± 392 mL. Milk left people in slightly positive balance; the difference of 326 ± 354 mL only approached significance (P=0.051). Time to exhaustion was the same (39.7 ± 8.1 vs 39.6 ± 7.3 min).
- — Abstract only; n=7.
- — Heart rate and rectal temperature were higher on the milk trial.
Desbrow 20147
After exerciseFluid retainedDifferent protocolNot recorded in the evidence file. Post-exercise rehydration; abstract only.
What each group drank in Desbrow 2014, and what was measured Sustagen Sport Retention 65.1 ± 14.7%. Soy milk Retention 46.9 ± 19.9%. Cow's milk Retention 40.0 ± 24.9%. Powerade Retention 16.6 ± 16.5%. Each of the other three drinks had higher reported retention than the sports drink.
- — Abstract only.
Rodriguez-Sanchez 20238
At restUrine outputDifferent protocol12 young (24.5 y) and 11 older (63.8 y) men. 1 L over 60 min (250 mL every 15 min); urine for 3 h; no BHI calculated. Macronutrients from labels; electrolytes by flame photometry, with 'mmol' headers that give no volume.
What each group drank in Rodriguez-Sanchez 2023, and what was measured Waterreference Cumulative urine at 1, 2 and 3 h: young 825, 1082, 1177 g; older 544, 791, 987 g. Fruit juice drink (reduced sugar)Tropicana Trop50 (UK) Cumulative urine at 1, 2 and 3 h: young 773, 1009, 1082 g; older 599, 878, 1037 g. Sports drinkLucozade Sport (UK) Cumulative urine at 1, 2 and 3 h: young 804, 1034, 1120 g; older 610, 861, 994 g. Low-fat (1%) milk Cumulative urine at 1, 2 and 3 h: young 635, 822, 956 g; older 625, 851, 978 g. Net fluid balance after milk differed from water in the young men only. Milk improved fluid retention in young men but not in older men, who already retained more water.
- — No BHI reported; ratios of group-mean urine are not individual-level BHI, so none are given.
- — 60-min drinking, men only, small groups.
Peden 20249
At restUrine outputDifferent protocol10 men. Each drink's volume set to deliver 1000 mL of water; urine over 210 min (30 min of drinking plus 180 min); no water trial.
What each group drank in Peden 2024, and what was measured Skimmed milkSainsbury's Total urine 986 ± 254 g. Soya drinkAlpro Total urine 950 ± 248 g (P=0.435 vs milk). Soya drink and skimmed milk gave similar urine output.
- — No water arm, so no BHI.
- — Urine by time point is shown only in a figure and is not used.
James 201310
After exerciseFluid retainedDifferent protocolNot recorded in the evidence file. Post-exercise rehydration at 150% of body mass lost. All drinks 1087 kJ/L; Na about 20-21 and K 4-5 mmol/L; fat 0.7 g/L; osmolality 280, 264 and 252 mOsm/kg listed in the order C, CP20, CP40.
What each group drank in James 2013, and what was measured C Retention 46 ± 9%; net fluid balance -470 ± 154 mL. CP20 Retention 59 ± 12%; net fluid balance -181 ± 280 mL. CP40 Retention 64 ± 6%; net fluid balance -107 ± 126 mL. Retention rose as milk protein replaced carbohydrate.
- — Post-exercise protocol.
James 201411
After exerciseFluid retainedDifferent protocolNot recorded in the evidence file. Post-exercise rehydration; abstract only.
What each group drank in James 2014, and what was measured Waterreference Urine 1234 ± 358 mL; retention 40 ± 14%. Whey protein isolate Urine 1306 ± 268 mL; retention 37 ± 14%. Whey protein isolate alone did not improve retention over water.
- — Abstract only.
Composition
What is actually in a glass
Each variant on one scale, with water as the baseline. Switch the serving to whichever glass you actually drink from.
Serving size
Showing 250 mL · 8.5 fl oz of each.
| Drink | Waterby weight | Water in itper serving | Calories | Sugars | Protein | Sodium | Potassium | Calcium |
|---|---|---|---|---|---|---|---|---|
 Whole milkFDC 2705385 Whole milkFDC 2705385 | 88.1% | 227mL7.7 fl oz | 157kcal | 12.4g | 8.4g | 98mg | 387mg | 317mg |
| 2% milkFDC 2705386 | 89.1% | 230mL7.8 fl oz | 129kcal | 12.6g | 8.7g | 101mg | 410mg | 325mg |
| 1% milkFDC 2705387 | 89.7% | 231mL7.8 fl oz | 111kcal | 12.8g | 8.7g | 101mg | 410mg | 325mg |
 Skim milkFDC 2705388 Skim milkFDC 2705388 | 90.8% | 234mL7.9 fl oz | 88kcal | 13g | 8.8g | 106mg | 431mg | 340mg |
 Chocolate milk (1%)FDC 2705470 Chocolate milk (1%)FDC 2705470 | 84.5% | 221mL7.5 fl oz | 168kcal | 26g | 9.1g | 170mg | 451mg | 338mg |
 Oat milkFDC 2705412 Oat milkFDC 2705412 | 91.3% | 235mL8 fl oz | 116kcal | 5.3g | 1.7g | 111mg | 46mg | 400mg |
 Soy milk, unsweetenedFDC 2705405 Soy milk, unsweetenedFDC 2705405 | 92.4% | 238mL8.1 fl oz | 98kcal | 1.4g | 9.2g | 88mg | 407mg | 260mg |
 Almond milk, unsweetenedFDC 2705409 Almond milk, unsweetenedFDC 2705409 | 97.4% | 251mL8.5 fl oz | 39kcal | 0g | 1.4g | 155mg | 80mg | 446mg |
 Water (for comparison)FDC 2710707 Water (for comparison)FDC 2710707 | 99.9% | 253mL8.6 fl oz | 0kcal | 0g | 0g | 10mg | 0mg | 8mg |
USDA publishes composition per 100 grams, so each serving is converted through the item's density — about 1.0313 g/mL for cow's milk. Those densities come from rounded household portion weights, so treat them as good to a couple of percent. Water mass is shown as millilitres on the basis that 1 g of water is 1 mL.2
Which USDA entries these areHide the USDA entries
- Whole milk: Milk, whole — FDC 2705385, Food and Nutrient Database for Dietary Studies (FNDDS) 2024-10-31
- 2% milk: Milk, reduced fat (2%) — FDC 2705386, Food and Nutrient Database for Dietary Studies (FNDDS) 2024-10-31
- 1% milk: Milk, low fat (1%) — FDC 2705387, Food and Nutrient Database for Dietary Studies (FNDDS) 2024-10-31
- Skim milk: Milk, fat free (skim) — FDC 2705388, Food and Nutrient Database for Dietary Studies (FNDDS) 2024-10-31
- Chocolate milk (1%): Chocolate milk, low fat (1%) — FDC 2705470, Food and Nutrient Database for Dietary Studies (FNDDS) 2024-10-31
- Oat milk: Oat milk — FDC 2705412, Food and Nutrient Database for Dietary Studies (FNDDS) 2024-10-31
- Soy milk, unsweetened: Soy milk, unsweetened — FDC 2705405, Food and Nutrient Database for Dietary Studies (FNDDS) 2024-10-31
- Almond milk, unsweetened: Almond milk, unsweetened — FDC 2705409, Food and Nutrient Database for Dietary Studies (FNDDS) 2024-10-31
- Water (for comparison): Water, tap — FDC 2710707, Food and Nutrient Database for Dietary Studies (FNDDS) 2024-10-31
Your glass
Your glass, counted
Pick a drink and a size to see the water it delivers, what it costs you in calories and sugar, and where it lands against your daily goal.
250 mL · 8.5 fl oz
68 fl oz. Not sure? The intake calculator works it out from your weight.
250 mL of whole milk delivers
227mL of water
7.7 fl oz · 88.1% water by weight
Counted as volume rather than water content, it is 12.5% of the goal, which is how Water Goose logs it: the whole glass, with no hydration multiplier. The guidance is making a narrower point: EFSA and NASEM both count the water a drink carries toward your total intake — the water in it, rather than the volume of the glass.23,24
- Calories
- 157kcal
- Sugars
- 12.4g
- Protein
- 8.4g
- Sodium
- 98mg
- Potassium
- 387mg
- Calcium
- 317mg
In Water Goose this logs as Milk at full volume — a 250 mL glass counts as 250 mL, with no hydration multiplier.
Composition from USDA FoodData Central, converted through each drink’s density.2 Work out your daily goal
Mechanism
Why it holds water (or doesn't)
Milk is not doing anything exotic. It holds fluid for the same reasons an oral rehydration solution does, plus two of its own.
- Moderate evidenceRandomised trial
The beverage hydration index study attributes milk's high score to its electrolytes and energy. Full-fat and skimmed milk scored alike, so fat content did not change the result.1
2-h BHI: full-fat milk 1.50 ± 0.58 (3.6 g fat/100 mL, 640 kcal/L); skimmed milk 1.58 ± 0.60 (0.1 g fat/100 mL, 350 kcal/L). Corrected effect sizes 0.89 and 1.14. Both milks Na 18-19 and K 40-41 mmol/L.
Caveat: A single 1 L bolus at rest. Milk's energy load of 350-640 kcal/L matters for everyday use.
- Moderate evidenceRandomised trial
At rest and already hydrated, drinks with 27 or 52 mmol/L of sodium produced less urine and better net fluid balance than drinks with 7 or 15 mmol/L.12
27 and 52 mmol/L vs 7 and 15 mmol/L sodium (p<.05); 1 L drinks; 4 h.
Caveat: Abstract only.
- Moderate evidenceReview
Large volumes of plain water trigger prompt urination after exercise. Added sodium helps the body keep fluid by maintaining extracellular fluid osmolality and volume, and carbohydrate and protein change how water is absorbed and distributed.13
- Moderate evidenceReview
Skimmed milk rehydrates better than a carbohydrate-electrolyte sports drink after exercise, and part of the effect seems to come from milk protein, which beat an equal-energy amount of carbohydrate. Evidence for whey protein is mixed.14
Caveat: Abstract only.
- Moderate evidenceReview
A rehydration drink's volume must exceed the water lost, and its formulation controls how fast it leaves the stomach and is absorbed in the small intestine.15
Caveat: Abstract only; a corrigendum exists.
How concentrated these drinks actually are
Osmolality is what decides how fast a drink leaves the stomach and how water moves in the gut. Blood sits at roughly 275–295 mOsm/kg17. Drinks near that range empty quickly; concentrated ones sit far above it.
| Drink | Osmolality | Spread | n |
|---|---|---|---|
| Cow's milk, pasteurised18 | 277.8mOsm/kg | SD 8 | 20 |
| Cow's milk, UHT18 | 282.7mOsm/kg | SD 7.9 | 5 |
| Cow's milk, skim, UHT18 | 273mOsm/kg | SD 7.7 | 10 |
| Cow's milk, lactose-reduced, UHT18Splitting lactose into glucose and galactose raises osmolality. | 389.1mOsm/kg | SD 5.6 | 5 |
| Soy-based drink18 | 213.7mOsm/kg | SD 8.4 | 10 |
| Milk permeate oral hydration solution224% carbohydrate, Na 21, K 28 mmol/LHyperosmolal, yet it retained more fluid than water in the same study. | 621mOsm/kg | SD 5 | — |
The honest part
When water is still the better pick
Everything above is real and everything above is narrow. Here is where milk stops being the better answer.
Milk brings calories that water does not
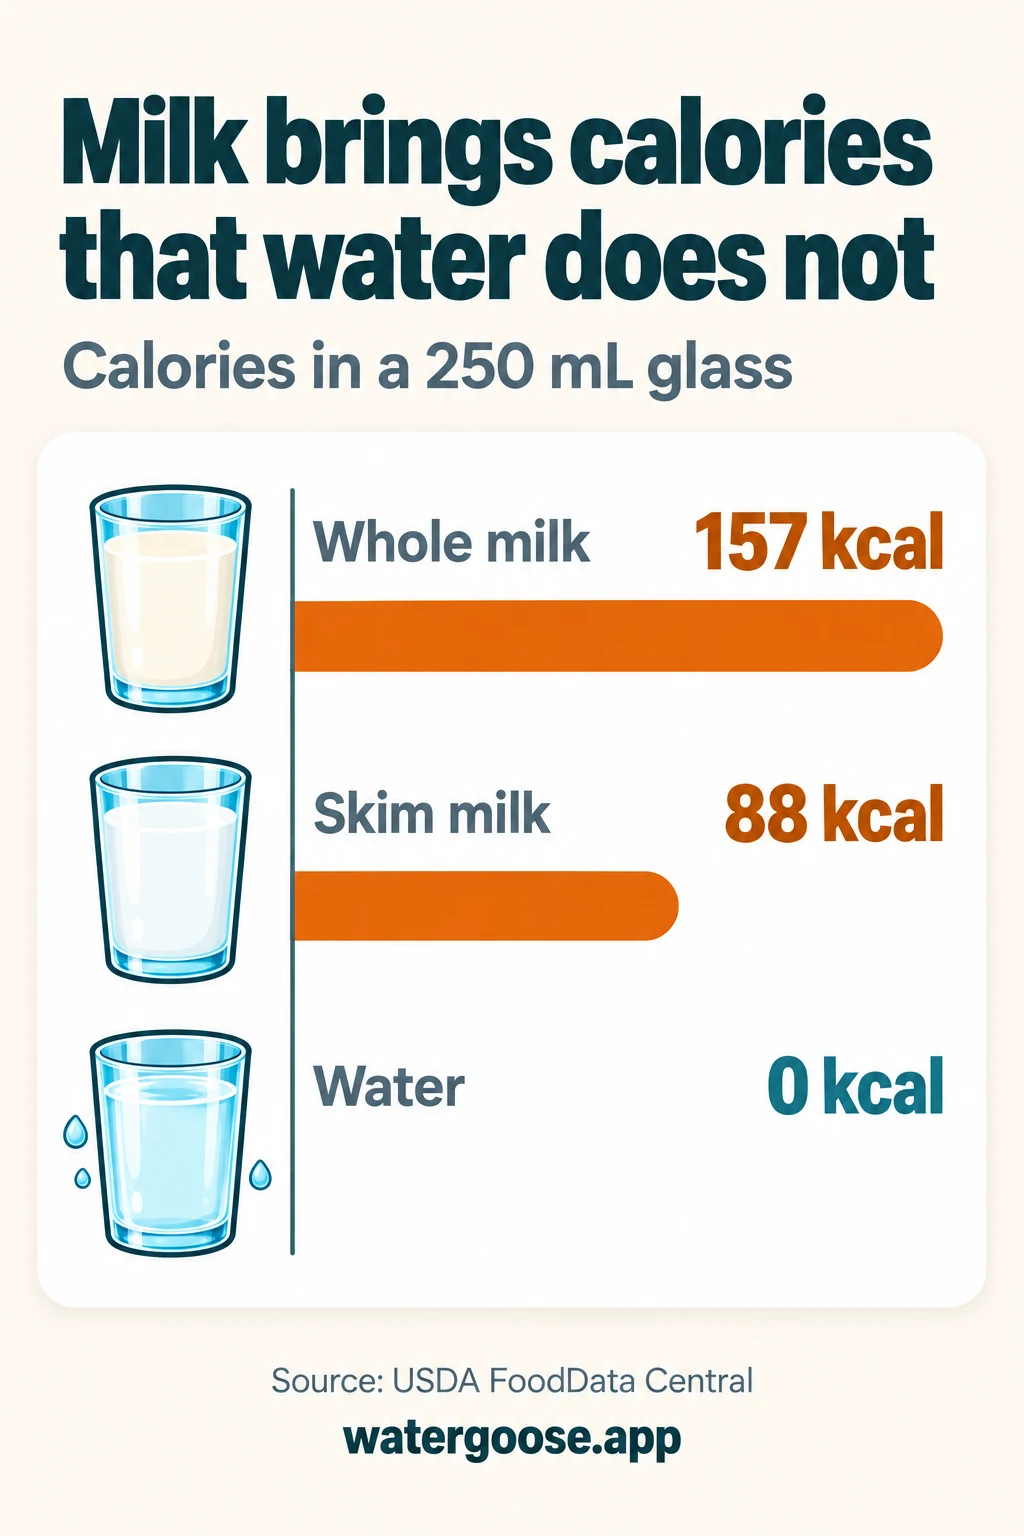
The trial fed everyone a full litre. At USDA's figures that is 629 kcal of whole milk or 351 kcal of skim, against zero for water. A 250 mL glass of whole milk is about 157 kcal. If you are drinking to a daily fluid target, replacing water with milk means drinking your target in food energy too.2,1
If you are lactose intolerant, the evidence does not cover you
The post-exercise milk trial excluded people with lactose intolerance by design, and no hydration index study has tested lactose-free milk. Splitting lactose into glucose and galactose raises osmolality: lactose-reduced UHT milk measured 389.1 mOsm/kg against 273-283 for ordinary milk. Undigested lactose pulls water into the gut, and the resulting diarrhoea loses fluid rather than holding it.3,18
The index measures two to four hours, not a day
Every number here comes from rested, already-hydrated young men drinking a litre in 30 minutes, with urine collected for four hours. The authors are explicit that this describes a short window rather than all-day hydration, and no study has followed milk against water across 24 hours. A drink that holds fluid for three hours has not been shown to keep you better hydrated by bedtime.1
Plant milks are not covered by any of this
Oat, soy and almond milk have no beverage hydration index. The one close measurement matched a soy drink and skim milk for water content and found almost identical urine output. Treat the plant-milk rows in the table above as composition, not as evidence of retention.9,2
Water is still the sensible default, and the guidance agrees
The NHS says drinks besides water count toward fluid intake, naming water, lower-fat milk and sugar-free drinks including tea and coffee, and recommends 6 to 8 cups or glasses a day. That is the useful framing: milk counts, and on the measured evidence it counts generously. It is a good choice after a hard session, or when you are struggling to eat. It is a poor choice as the thing you drink all day, and nothing in this data says otherwise.16
If a clinician has capped your fluid, this page does not apply
Heart failure, kidney disease and some medications come with a fluid limit, and in that situation the composition of a drink matters far less than its volume. Follow the number you were given rather than anything derived from a study in healthy young men.
Labels
What the labels say
Published panels for products people actually buy. These are label values for one flavour and package, not laboratory measurements, and none of the brands here had any involvement in this page.
| Product | Serving | Calories | Sugars | Protein | Sodium | Potassium |
|---|---|---|---|---|---|---|
| fairlife192% Reduced Fat Ultra-Filtered Milk | 1 cup (240 mL) | 120 | 6 g | 13 g | 120 mg | 400 mg |
| Oatly20Original Oatmilk | 1 cup (240 mL) | 120 | 7 g | 3 g | 100 mg | 390 mg |
| Silk21Original Almondmilk | 1 cup (240 mL) | 60 | 7 g | 1 g | 150 mg | 0 mg |
Labels checked 2026-09-15. A dash means the label does not publish that value — it is not a zero. Formulations and panels change, so treat these as a snapshot and check the carton in your hand.
- fairlife: Total fat 4.5 g; calcium 380 mg. Contains lactase enzyme.
- Oatly: 7 g added sugars; total fat 5 g; fibre 2 g; calcium 350 mg.
- Silk: Potassium is printed on the panel as 0 mg.
- Silk: 7 g added sugars; total fat 2.5 g; calcium 470 mg.
Questions
Milk and hydration, question by question
Does milk hydrate you?
Yes. In the trial that created the beverage hydration index, a litre of skim milk and a litre of whole milk both left less fluid in the bladder two hours later than the same volume of still water: an index of 1.58 and 1.50 against water's 1.00, and roughly a fifth less urine over four hours. That is measured short-term retention in rested, already-hydrated young men, not a verdict on what to drink all day.1
Is milk more hydrating than water?
Over a two-to-four-hour window, by this measure, yes. Skim milk's two-hour index was 1.58 (SD 0.60) and whole milk's 1.50 (SD 0.58), both significantly above water. Correct for the fact that milk is only about 88-91% water and the advantage narrows to 1.44 and 1.32, where it stays significant. But holding fluid longer is not the same as being better to drink all day: milk brings 350-640 kcal per litre with it, and no study has compared milk with water across a full 24 hours.1,2
Can I count milk as water intake?
Yes. The NHS names lower-fat milk among the drinks that count toward fluid intake, EFSA counts water from beverages of all kinds, and NASEM counts the water in drinks and in food toward total intake. Water Goose logs milk as Milk at its full volume, so a 250 mL glass counts as 250 mL. If you want the pedantic version: whole milk is 88.1% water by weight, so that glass carries about 227 mL of actual water.16,23,24,2
Is chocolate milk hydrating?
Nobody has run chocolate milk through the beverage hydration index, so there is no measured answer for it. What is known is the composition: USDA's low-fat chocolate milk is 84.5% water against 89.7% for plain 1% milk, and it carries 9.9 g of sugars per 100 g against 4.96 g. It keeps the electrolytes that make plain milk interesting, at 172 mg of potassium and 65 mg of sodium per 100 g, so there is no reason to expect it to hydrate worse. The sugar is real and the evidence is absent.2,1
Is whole milk or skim milk more hydrating?
They performed the same. Skim milk's two-hour index was 1.58 and whole milk's 1.50, both significantly above water, and the authors concluded that fat content did not change the result. Skim is 90.8% water against whole milk's 88.1%, and carries 34 kcal per 100 g against 61. If you are choosing on hydration alone the difference is not measurable; if you are choosing on calories, it is.1,2
Is oat, soy or almond milk hydrating?
They hydrate, but none of them has a beverage hydration index. The closest measurement is a Loughborough trial that matched a soy drink and skim milk for water content and found almost the same urine output over 210 minutes: 950 g after the soy drink against 986 g after the milk. By composition, plant milks are mostly water -- USDA puts unsweetened almond milk at 97.4%, unsweetened soy at 92.4% and oat at 91.3%. They are not nutritionally interchangeable with cow's milk, though: almond milk has 0.55 g of protein and 31 mg of potassium per 100 g where whole milk has 3.27 g and 150 mg.9,2
Does milk still hydrate you if you are lactose intolerant?
The studies cannot tell you. The post-exercise milk trial excluded people with lactose intolerance by design, and no beverage hydration index study has tested lactose-free milk. Undigested lactose draws water into the gut, which is the mechanism behind the cramping and the diarrhoea, and diarrhoea loses fluid rather than keeping it. Lactose-free milk is made by splitting lactose into glucose and galactose, which raises osmolality: one survey measured lactose-reduced UHT milk at 389 mOsm/kg against 273-283 for ordinary milk. What that does to retention has not been measured.3,18
Is milk the most hydrating drink?
Skim milk had the highest mean score of the thirteen drinks tested, but calling it the most hydrating drink oversells a single two-hour measurement in 72 rested men, with about 17 people per drink and a repeatability of roughly 18%. An oral rehydration solution scored 1.54, and the study cannot tell you whether milk beat it: each drink was compared with a pooled water arm, never against the other drinks. And the ranking says nothing about a whole day: the index measures how long a litre stays in you, not whether a drink is a sensible daily habit.1
Receipts
Sources and how we compiled this
Where the composition comes from
U.S. Department of Agriculture, Agricultural Research Service. FoodData Central. Built 2026-09-15 from the published CSV releases, never hand-typed.
- Food and Nutrient Database for Dietary Studies (FNDDS) · 2024-10-31
- — Drinks and prepared foods use FNDDS (foods and drinks as consumed) whenever FNDDS has a code for the item.
- — Raw produce and dairy foods use Foundation Foods when the entry is current (listed in foundation_food.csv), stands for the food generally rather than one cultivar or colour, and reports water, energy and potassium, plus fiber for plant foods. Otherwise SR Legacy.
- — A Foundation pick with no household portions uses the portions of the SR Legacy entry for the same food (portionsSource).
- — Fluid milks use FNDDS, whose composition matches the Foundation analyses (crossCheck) and which has consistent drink portions.
- — SR Legacy fills any remaining gap. No proxy is used where USDA has no sensible entry (see missing).
What this evidence cannot tell you
- — The Beverage Hydration Index measures short-term retention, not 24-h hydration: for each person it is urine after still water divided by urine after the test drink, anchored 2 h after drinking 1 L over 30 min.
- — Most participants were young, healthy, euhydrated, fasted, rested men given a single 1 L dose. Older adults retain more water and respond differently.
- — Post-exercise retention percentages come from dehydrated people drinking 100-150% of the body mass they lost. They are not comparable to BHI values and must not share a scale with them.
- — Clarke 2019 reports mean ± SEM while most studies report SD, so spreads are not directly comparable.
- — No resting BHI data were found for soup, smoothie, lemonade or coconut water. Energy-drink evidence comes from one modified-protocol study, and soda evidence is cola and diet cola from Maughan 2016 only.
- — Many of these studies are industry funded: the European Hydration Institute, Entrinsic, Dairy Management, Nuun, Coca-Cola, Buoy, Lingtea, QCK, the Almond Board, 8 POiNT, VitaCoco, Liquid I.V., Innate-Essence and ITO EN all appear as funders.
- — Commercial formulations change over time. Compositions are as measured or labelled at the time of each study and are not current labels.
Who paid for the research
Hydration research is heavily industry funded. That does not make a study wrong, but you should know who paid before you weigh it. Water Goose took no money from anyone named here, and no brand saw this page before it went up.
- — Maughan 2016: Funded by a grant from the European Hydration Institute (EHI). Prof Maughan chairs the EHI Scientific Advisory Board (not the Institute itself); Dr Watson has also received EHI funding.
- — Berry 2020: Funded by Dairy Management Inc.
References
Every number on this page points at one of these. Product labels were checked 2026-09-15.
- 1
Maughan RJ, Watson P, Cordery PAA, Walsh NP, Oliver SJ, Dolci A, Rodriguez-Sanchez N, Galloway SDR. A randomized trial to assess the potential of different beverages to affect hydration status: development of a beverage hydration index. Am J Clin Nutr 2016;103(3):717-723.
StudyRead: full textOpen source
Funding: Funded by a grant from the European Hydration Institute (EHI). Prof Maughan chairs the EHI Scientific Advisory Board (not the Institute itself); Dr Watson has also received EHI funding.
Read from the LJMU green open-access accepted manuscript (https://researchonline.ljmu.ac.uk/id/eprint/12468/); the publisher page was blocked. ISRCTN13014105.
- 2
U.S. Department of Agriculture, Agricultural Research Service. FoodData Central (SR Legacy and Foundation Foods).
DatasetRead: official pageOpen source
Water content is not the same thing as a net hydration effect.
- 3
Shirreffs SM, Watson P, Maughan RJ. Milk as an effective post-exercise rehydration drink. Br J Nutr 2007;98(1):173-180.
StudyRead: full textOpen source
The paper calls the milk 'low-fat milk (0.2% fat)'. Its abstract lists the water and sports-drink urine volumes in reverse order; evidence.ts uses the Results.
- 4
Seery S, Jakeman P. A metered intake of milk following exercise and thermal dehydration restores whole-body net fluid balance better than a carbohydrate-electrolyte solution or water in healthy young men. Br J Nutr 2016;116(6):1013-1021.
StudyRead: abstractOpen source
- 5
Sayer L, et al. Int J Sport Nutr Exerc Metab 2020.
StudyRead: abstractOpen source
- 6
Watson P, Love TD, Maughan RJ, Shirreffs SM. A comparison of the effects of milk and a carbohydrate-electrolyte drink on the restoration of fluid balance and exercise capacity in a hot, humid environment. Eur J Appl Physiol 2008;104(4):633-642.
StudyRead: abstractOpen source
- 7
Desbrow B, et al. Appl Physiol Nutr Metab 2014.
StudyRead: abstractOpen source
- 8
Rodriguez-Sanchez N, Galloway SDR. A randomised trial to assess fluid and electrolyte balance responses following ingestion of different beverages in young and older men. Eur J Appl Physiol 2023;123(10):2331-2340.
StudyRead: full textOpen source
Same urine protocol as the BHI, but drinks taken over 60 min and no BHI calculated.
- 9
Peden DL, et al. (senior author James LJ). Eur J Appl Physiol 2024.
StudyRead: full textOpen source
Loughborough University. Skimmed milk vs soya drink fluid retention; no water arm. Data on figshare (26075815).
- 10
James LJ, et al. Br J Nutr 2013;110:1285-1291.
StudyRead: full textOpen source
- 11
James LJ, et al. Amino Acids 2014.
StudyRead: abstractOpen source
- 12
Maughan RJ, Watson P, Cordery PAA, Walsh NP, Oliver SJ, Dolci A, Rodriguez-Sanchez N, Galloway SDR. Sucrose and sodium but not caffeine content influence the retention of beverages in humans under euhydrated conditions. Int J Sport Nutr Exerc Metab 2019;29(1):51-60.
StudyRead: abstractOpen source
Abstract describes a double-blind crossover design. Numeric BHI values are not in the abstract. Peden 2024 describes the sucrose result differently (only the 20% drink raising BHI).
- 13
Evans GH, James LJ, Shirreffs SM, Maughan RJ. Optimizing the restoration and maintenance of fluid balance after exercise-induced dehydration. J Appl Physiol 2017;122(4):945-951.
StudyRead: abstractOpen source
- 14
James L. Milk protein and the restoration of fluid balance after exercise. Med Sport Sci 2012;59:120-126.
StudyRead: abstractOpen source
- 15
Leiper JB. Fate of ingested fluids: factors affecting gastric emptying and intestinal absorption of beverages in humans. Nutr Rev 2015;73(Suppl 2):57-72.
StudyRead: abstractOpen source
Corrigendum: Nutr Rev 2020;78(9):781 (PMID 32159769).
- 16
NHS. Water, drinks and your health.
GuidelineRead: official pageOpen source
Page last reviewed 17 May 2023; next review was due 17 May 2026, so the review is overdue as of September 2026.
- 17
Sadowska A, Świderski F, Rakowska R, Waszkiewicz-Robak B, Żebrowska-Krasuska M, Dybkowska E. Beverage osmolality as a marker for maintaining appropriate body hydration. Rocz Panstw Zakl Hig 2017;68(2):167-173.
StudyRead: full textOpen source
Polish market products. This is the source of the 275-295 mOsm/kg range (it describes the isotonic drinks tested), not Maughan 2016.
- 18
Dini E, De Abreu J, López E. Osmolalidad de bebidas de consumo frecuente [Osmolality of frequently consumed beverages]. Invest Clin 2004;45(4):323-335.
StudyRead: full textOpen source
Venezuelan products, 2002-2003; vapour-pressure osmometer. Its 'natural' fruit drinks are lab blends of pulp diluted with water, not 100% juice (only the orange juice was undiluted).
- 19
fairlife. 2% Reduced Fat Ultra-Filtered Milk, nutritional facts.
Product labelRead: official pageOpen source
- 20
Oatly US. Original Oatmilk 32 oz, nutrition facts.
Product labelRead: official pageOpen source
- 21
Silk. Original Almondmilk, nutrition facts.
Product labelRead: official pageOpen source
- 22
Berry CW, Wolf ST, Murray B, Kenney WL. Hydration efficacy of a milk permeate-based oral hydration solution. Nutrients 2020;12(5):1502.
StudyRead: full textOpen source
Funding: Funded by Dairy Management Inc.
- 23
EFSA Panel on Dietetic Products, Nutrition, and Allergies (NDA). Scientific Opinion on Dietary Reference Values for water. EFSA Journal 2010;8(3):1459.
GuidelineRead: full textOpen source
Read from the DTU Orbit copy of the published PDF; Wiley was blocked.
- 24
Institute of Medicine. Dietary Reference Intakes for Water, Potassium, Sodium, Chloride, and Sulfate. Chapter 4: Water. Washington, DC: The National Academies Press; 2005.
GuidelineRead: full textOpen source
Cite this directly for adequate intakes: Maughan 2016's introduction misstates the women's figure. On alcohol it concludes the diuresis is transient; it makes no explicit 'all drinks count equally' statement.
Other drinks, measured
- Every drink, measured against waterThe whole index in one chart, with the composition of all 23 drinks underneath.
- Does Gatorade hydrate you?The other drink built around sodium, and when the sugar is worth it.
- Does orange juice hydrate you?Juice and lemonade, and what the water-content correction does to them.
- Does soda hydrate you?Cola and diet cola on the same index, with the caffeine and sugar per can.
Free tools
- Water intake calculatorYour daily target from weight, activity, climate and altitude — shown in ounces, millilitres, litres, cups and bottles at once.
- Hydration colour chartTap the shade that matches. Get a plain reading and how much to drink to correct it.
- Sweat rate calculatorWeigh in, train, weigh out. Get your litres-per-hour, your fluid deficit, and how much to drink per hour next time.
Related reading
- How to hydrate fasterWhat to do when you are already behind, rather than what to drink day to day.
- Does coffee count towards water intake?The same question for the drink most people have before their first glass of water.
- Where the 8 glasses a day rule came fromWhy the number you are measuring milk against is shakier than it sounds.
This page describes what studies measured in healthy adults. It is general wellness information, not medical advice, diagnosis or treatment. Fluid needs change with health conditions, medication and pregnancy — and some conditions require drinking less. Talk to a clinician about yours.
Keep the number
This page can tell you that a 250 mL glass of milk carries about 227 mL of water. Water Goose is what remembers you drank it.
Free on iPhone and Android. Water Goose Plus unlocks saving and customising.