Measured against water
Does Coke hydrate you? Soda and diet soda vs water
Hydrates — no different from water over 2 hours
Yes. In the only trial that has measured it, cola held fluid as well as still water over two hours, and so did diet cola — neither differed significantly from water. A 12 fl oz can of Coke carries about 34 mg of caffeine, nowhere near the 250-300 mg where a measurable diuretic effect starts. What it does carry is 39 g of sugar and 140 calories, and that, not hydration, is the reason to keep it occasional.1,3,4,5
Last reviewed 30 sourcesWritten from the studies, not from other websites
The measurement
Soda, measured against water
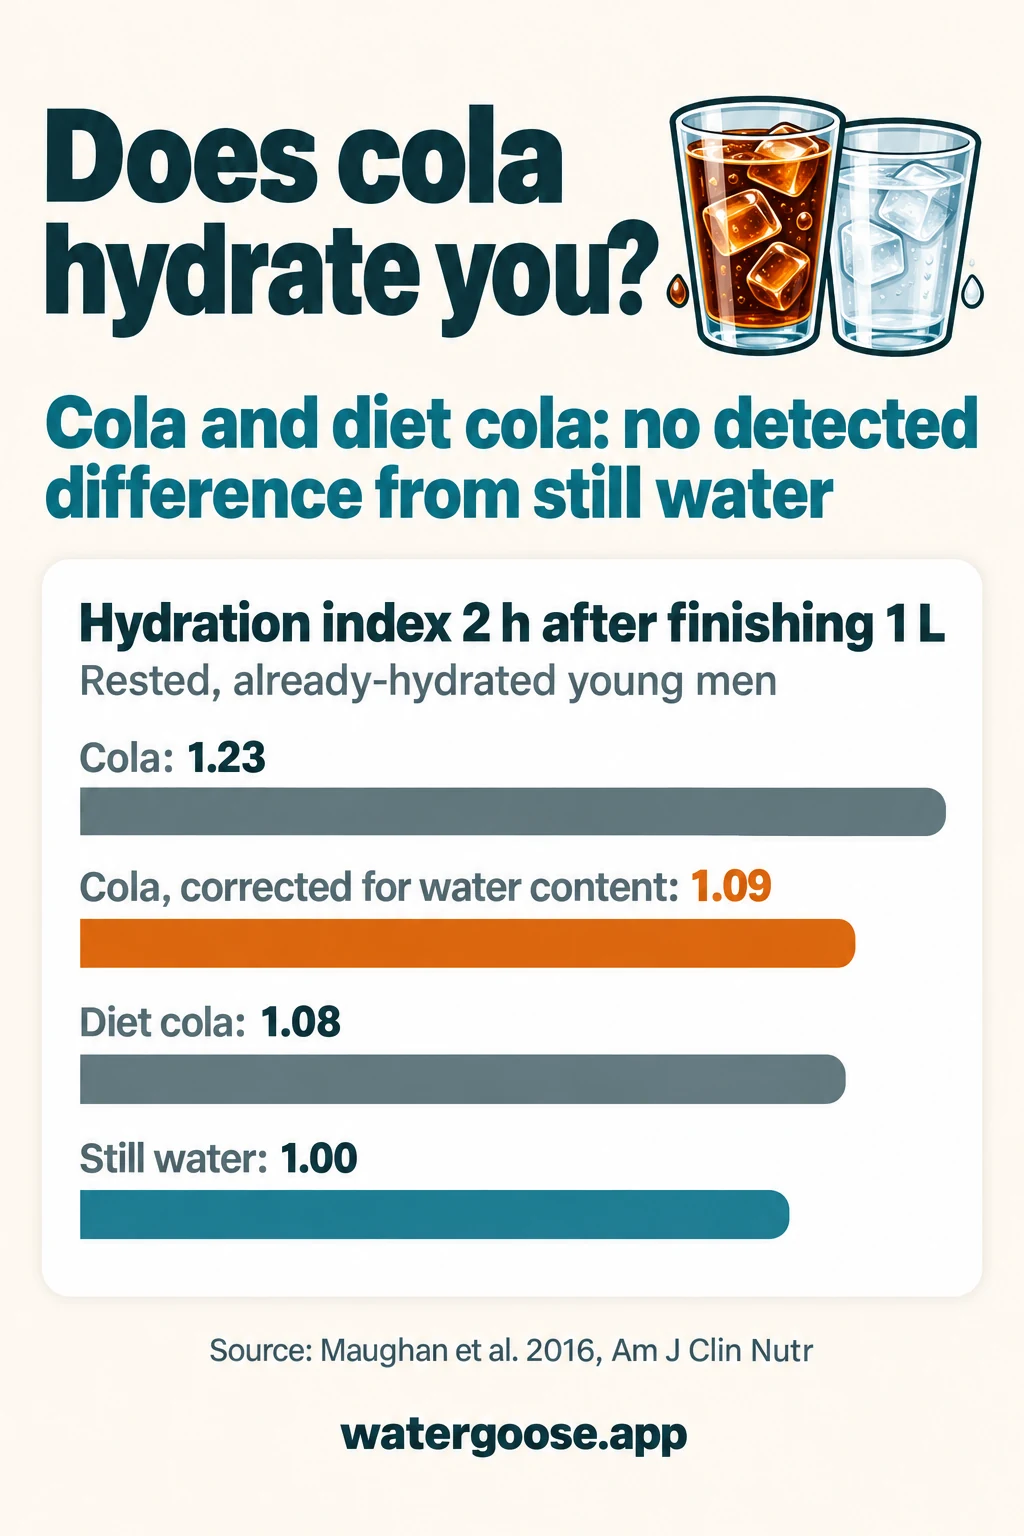
Hydration researchers have a number for this. The beverage hydration index compares the urine you produce after a drink against the urine you produce after the same volume of still water: above 1.00 means more of it stayed in you. In the 2016 trial that created the index, 72 healthy men drank a litre over 30 minutes and had their urine collected for four hours. Cola came out at 1.23 and diet cola at 1.08, and neither differed significantly from water. Only skim milk (1.58), an oral rehydration solution (1.54), full-fat milk (1.50) and orange juice (1.39) cleared that bar; cola, diet cola, sparkling water, a sports drink, coffee, tea and lager all sat in water's statistical bucket.
- Skimmed milk1.58
- Oral rehydration solution1.54
- Full-fat milk1.50
- Orange juice1.39
- Cola1.23
- Diet cola1.08
- Cold black tea1.07
- Hot black tea1.03
- Sports drink1.02
- Still waterreference1.00
- Lager0.99
- Sparkling water0.98
- Coffee (hot, black)0.91
Significance as marked on the paper’s Figure 2: ** P<0.01, * P<0.05 vs waterWhiskers are 1 SD
Show the data tableHide the data table
| Drink | Index2 h | Correctedwater content | SD | vs water | n |
|---|---|---|---|---|---|
| Skimmed milkTesco, 0.1% fat | 1.58 | 1.44 | 0.60 | Above water | 17 |
| Oral rehydration solutionDioralyte, made up with Highland Spring water | 1.54 | 1.50 | 0.74 | Above water | 17 |
| Full-fat milkTesco, 3.6% fat | 1.50 | 1.32 | 0.58 | Above water | 17 |
| Orange juiceTesco Everyday Value | 1.39 | 1.24 | 0.64≈ | Above water | 16 |
| ColaCoca-Cola | 1.23 | 1.09 | 0.54≈ | No detected difference | 17 |
| Diet colaDiet Coke | 1.08 | 1.08 | 0.24≈ | No detected difference | 16 |
| Cold black teaPG tips | 1.07 | 1.07 | 0.59≈ | No detected difference | 17 |
| Hot black teaPG tips | 1.03 | 1.03 | 0.24≈ | No detected difference | 15 |
| Sports drinkPowerade | 1.02 | 0.98 | 0.24≈ | No detected difference | 17 |
| Still waterHighland Spring | 1.00 | 1.00 | — | Reference drink | 72 |
| LagerCarling | 0.99 | 0.94 | 0.31≈ | No detected difference | 17 |
| Sparkling waterHighland Spring | 0.98 | 0.98 | 0.20≈ | No detected difference | 17 |
| Coffee (hot, black)Nescafe Original instant | 0.91 | 0.90 | 0.31≈ | No detected difference | 17 |
≈ marks a standard deviation read from the paper’s figures rather than its text. “Corrected” adjusts each drink for its own water content, which is the fairer comparison and the one that moves orange juice below significance.
What this number is not
- — About 17 drinkers per test drink against a pooled water arm, so small differences such as coffee vs water cannot be detected.
- — Rested, already-hydrated young men drinking 1 L in 30 min; the result describes a 2-4 h window, not all-day hydration.
- — Caffeine at 96-212 mg in these drinks had no effect on net fluid balance. The authors cite a threshold of about 250-300 mg for a measurable diuretic effect (Maughan & Griffin 2003).
- — The lager's alcohol content was not reported, and no numeric 4-h BHI was reported for any drink.
- — Nine of the twelve BHI standard deviations, and eight of the twelve means, are only in the figures; they were read from the figure's vector data and match the text values to about 0.01.
- — The abstract says the BHI was corrected for water content, but the 1.58, 1.54 and 1.50 values are the uncorrected BHI.
What 1.23 does not mean
The rest of the evidence
What the other studies found
Cola and diet cola in one 2016 trial is the entire direct dataset, and this page is not going to pretend otherwise. Everything else was measured a different way, so none of it shares a scale with the index above: one trial takes the recipe apart ingredient by ingredient, one shows where the fluid actually is two hours later, one lets people drink as much fizzy water as they want, and one tests the drinks people line up next to soda — Celsius Live Fit and Prime Energy, both at 280 mg of caffeine a serving and roughly eight cans of Coke's worth, which held less fluid than water at four hours, against Liquid I.V.'s Energy Multiplier at 106 mg, which matched it. That one ran on a modified half-litre protocol and was funded by the maker of the drink that matched water.
Maughan 20196
At restHydration index3 separate cohorts of 12 young active men. Double-blind crossover; 1 L of drink; 4-h urine collection; BHI and net fluid balance.
What each group drank in Maughan 2019, and what was measured Sucrose 0, 5, 10 and 20% 10% and 20% sucrose gave lower urine output and higher net fluid balance than 0% and 5%. Sodium 7, 15, 27 and 52 mmol/L 27 and 52 mmol/L gave greater retention and BHI than 7 and 15 mmol/L. Caffeine 0-400 mg/L No effect of caffeine on urine output (p=0.83), and no differences in arginine vasopressin or aldosterone. Retention rose with sucrose (10-20%) and sodium (27-52 mmol/L); caffeine up to 400 mg/L had no effect.
- — Abstract only; no numeric BHI values.
- — Peden 2024 describes the sucrose result as only the 20% drink raising BHI, which conflicts with this abstract.
Clayton 20147
After exerciseFluid retainedDifferent protocol8 people. About 1.8% body-mass loss; drank 150% of the loss; gastric contents sampled to 120 min.
What each group drank in Clayton 2014, and what was measured 2% glucose-electrolyte drink 0.3% of the drink left in the stomach at 120 min; 52% retained at 240 min. 10% glucose-electrolyte drink 42.1% of the drink left in the stomach at 120 min (p<.001); 64% retained at 240 min. The 10% drink's higher apparent retention partly reflected fluid still in the stomach; once that was accounted for, the 2% drink gave the better net fluid balance at 60 and 120 min.
- — Abstract only.
Takamata 20268
Mildly dehydratedFluid retainedDifferent protocol15 adults (8 women, 7 men). Drinking freely for 180 min after about 1% body-mass loss; urine in g per kg body mass.
What each group drank in Takamata 2026, and what was measured Waterreference Urine 7.56 ± 1.61 g/kg; retention 53.7 ± 5.9%. Cumulative intake was greatest with plain water. Carbonated water Urine 6.22 ± 1.01 g/kg; retention 42.5 ± 6.9%. Electrolyte water Urine 3.21 ± 0.58 g/kg; retention 68.3 ± 3.5%. Carbonated electrolyte water Urine 3.66 ± 0.68 g/kg; retention 68.8 ± 4.5%. Adding sodium increased retention; carbonation did not improve it. Stomach discomfort was higher with both carbonated drinks than with still electrolyte water (p=0.019 and p=0.004).
- — Free drinking, so volumes differ between drinks.
- — Funded by ITO EN, Ltd.; seven of thirteen authors are employees.
Funding: Funded by ITO EN, Ltd.; seven of the thirteen authors are ITO EN employees.
Millard-Stafford 20259
At restHydration indexDifferent protocol28 adults (14 men, 14 women); caffeine 3.7 ± 0.4 mg/kg in men and 4.8 ± 0.8 mg/kg in women. Randomised crossover; 250 mL water, 500 mL test drink, then 250 mL water, in four portions over 30 min; 240 min. Composition measured per 500 mL.
What each group drank in Millard-Stafford 2025, and what was measured Waterreference % retained at 240 min -48.2 ± 3.8 Caffeinated energy drink (CAF)Celsius Live Fit, mango passionfruit (carbonated) 0.86 (SD 0.16) at 240 minUrine 244 g more than CAF+CE. % retained -71.2 ± 21.5. Caffeinated energy drink with electrolytes (CAF+E)Prime Energy, orange mango 0.91 (SD 0.16) at 240 minUrine 162 g more than CAF+CE. % retained -65.1 ± 26.3. Caffeinated carbohydrate-electrolyte mix (CAF+CE)Liquid I.V. Energy Multiplier, mango tamarind, in 500 mL water 1.01 (SD 0.12) at 240 min% retained -46.4 ± 18.8. The two low-sodium drinks with 280 mg caffeine retained less fluid than water at 4 h; the lower-caffeine drink with electrolytes and carbohydrate matched water. Habitual caffeine use made no difference (0.92 ± 0.1 vs 0.93 ± 0.1, p=0.827). Women had a higher BHI than men with the caffeinated drinks (reported as +0.077, p=0.043; the abstract gives p=0.03).
- — Not the standard protocol: only 500 mL of test drink, so values are not comparable with 1-L BHI studies.
- — Funded by Liquid I.V. (Unilever), maker of the drink that matched water.
- — High caffeine per kg of body mass.
Funding: Funded by Liquid-IV, a Unilever company (grant GR00027334), maker of the Liquid I.V. Energy Multiplier that matched water in the trial. A Liquid IV principal scientist helped conceptualise and review the manuscript. The first author has also had funding from Coca-Cola, Kraft and Liquid IV.
Three more lines of evidence, each on a protocol of its own
Grandjean 2000: over a day, the differences wash out
Eighteen men drank combinations of water, caffeinated and non-caffeinated colas and coffee. There were no differences in body weight or in the blood and urine markers of hydration.10
Zhang 2015: caffeine's diuresis is small and disappears with exercise
Sixteen studies, 28 effect sizes, 379 people, at a median dose of 300 mg — nine times a can of Coke. At rest that produced about 120 mL more urine (effect size 0.54); during exercise there was no effect at all (0.10, P = 0.248).11
Killer 2014: three days of coffee matched three days of water
Fifty habitual coffee drinkers took about 308 mg of caffeine a day as coffee for three days. Total body water and 24-hour urine were no different from the same volume of water. The trial was funded by a coffee-industry science institute, which is named in the references.12
Composition
What is actually in a glass
Each variant on one scale, with water as the baseline. Switch the serving to whichever glass you actually drink from.
Serving size
Showing 355 mL · 12 fl oz of each.
| Drink | Waterby weight | Water in itper serving | Calories | Sugars | Protein | Sodium | Potassium | Calcium |
|---|---|---|---|---|---|---|---|---|
 ColaFDC 2710541 ColaFDC 2710541 | 89.4% | 332mL11.2 fl oz | 156kcal | 37g | 0g | 11mg | 19mg | 4mg |
 Diet colaFDC 2710542 Diet colaFDC 2710542 | 99.5% | 358mL12.1 fl oz | 7kcal | 0g | 0.4g | 29mg | 29mg | 11mg |
 Lemon-lime sodaFDC 173205 Lemon-lime sodaFDC 173205 | 89.5% | 329mL11.1 fl oz | 151kcal | 38.2g | 0.3g | 37mg | 4mg | 7mg |
 Ginger aleFDC 2710555 Ginger aleFDC 2710555 | 91.2% | 339mL11.5 fl oz | 126kcal | 33.1g | 0g | 26mg | 4mg | 11mg |
 Still water, for comparisonFDC 2710707 Still water, for comparisonFDC 2710707 | 99.9% | 360mL12.2 fl oz | 0kcal | 0g | 0g | 14mg | 0mg | 11mg |
USDA publishes composition per 100 grams, so each serving is converted through the item's own density — about 1.0482 g/mL for cola and ginger ale and 1.0144 g/mL for diet cola and water, each derived by USDA from that item's own 12 fl oz portion weight. Those weights are rounded household conventions, so treat the densities as good to a couple of percent. Water mass is shown as millilitres on the basis that 1 g of water is 1 mL. These are generic USDA drinks rather than any one label: USDA's cola gives 156 calories and 37 g of sugars per 12 fl oz where Coca-Cola's own FAQ gives 140 and 39 g. Either way, roughly nine to ten teaspoons of sugar.2
Which USDA entries these areHide the USDA entries
- Cola: Soft drink, cola — FDC 2710541, Food and Nutrient Database for Dietary Studies (FNDDS) 2024-10-31
- Diet cola: Soft drink, cola, diet — FDC 2710542, Food and Nutrient Database for Dietary Studies (FNDDS) 2024-10-31
- Lemon-lime soda: Beverages, carbonated, lemon-lime soda, no caffeine — FDC 173205, SR Legacy 2018-04
- Ginger ale: Soft drink, ginger ale — FDC 2710555, Food and Nutrient Database for Dietary Studies (FNDDS) 2024-10-31
- Still water, for comparison: Water, tap — FDC 2710707, Food and Nutrient Database for Dietary Studies (FNDDS) 2024-10-31
Why the diet cola and water rows read a shade high
Your glass
Your glass, counted
Pick a drink and a size to see the water it delivers, what it costs you in calories and sugar, and where it lands against your daily goal.
355 mL · 12 fl oz
68 fl oz. Not sure? The intake calculator works it out from your weight.
355 mL of cola delivers
332mL of water
11.2 fl oz · 89.4% water by weight
Counted as volume rather than water content, it is 17.7% of the goal, which is how Water Goose logs it: the whole glass, with no hydration multiplier. The guidance is making a narrower point: EFSA and NASEM both count the water a drink carries toward your total intake — the water in it, rather than the volume of the glass.29,30
- Calories
- 156kcal
- Sugars
- 37g
- Protein
- 0g
- Sodium
- 11mg
- Potassium
- 19mg
- Calcium
- 4mg
In Water Goose this logs as Soda at full volume — the app counts the whole can, and this page is the explanation of why that is a fair way to count it.
Composition from USDA FoodData Central, converted through each drink’s density.2 Work out your daily goal
Where the caffeine lands
Mechanism
Why it holds water (or doesn't)
A soda is a sugar solution with a little caffeine in it and gas dissolved in the top. Each of those three does something measurable, and the one people worry about — the caffeine — is the one doing the least.
- Moderate evidenceReview
Large single doses of caffeine briefly raise urine output, but mainly in people who have gone without caffeine for days or weeks. The caffeine in standard servings of tea, coffee and soft drinks appears to have no diuretic action.4
At least 250-300 mg of caffeine, which the review equates to 2-3 cups of coffee or 5-8 cups of tea. Literature searched from January 1966 to March 2002.
Caveat: Abstract only; the full text is paywalled.
- Moderate evidenceRandomised trial
Both carbohydrate content and osmolality slow how fast a drink leaves the stomach, and carbohydrate content matters more. A concentrated glucose drink took several times longer to empty than a dilute one.13
600 mL test drinks, n=6. Half-emptying time: 40 g/L glucose (230 mosmol/kg) 17 ± 1 min; 40 g/L glucose polymer (42 mosmol/kg) 14 ± 1 min; 188 g/L glucose polymer (237 mosmol/kg) 64 ± 8 min; 188 g/L glucose (1300 mosmol/kg) 130 ± 18 min. Values are mean ± SEM.
Caveat: Abstract only. 188 g/L is about 18.8% carbohydrate, roughly twice a typical cola.
- Moderate evidenceRandomised trial
After exercise, a hypertonic 10% glucose drink left much more fluid sitting in the stomach than a 2% drink, which explains part of its lower early urine output.7
n=8, about 1.8% body mass lost, drank 150% of the loss. At 120 min, 0.3% of the 2% drink and 42.1% of the 10% drink remained in the stomach (p<.001). Retained at 240 min 52% vs 64%. Once gastric residue was accounted for, net fluid balance was better with the 2% drink at 60 and 120 min.
Caveat: Abstract only.
- Moderate evidenceRandomised trial
Measured composition of 13 common drinks shows the sugary ones are far more concentrated than milk or the sports drink, which sit near the osmolality of the participants' own blood.1
Osmolality in mmol/kg, Na and K in mmol/L: still water 2 (Na 0); sparkling water 7 (Na 1); cola 432 (carbohydrate 10.6 g/100 mL, Na 2, caffeine 96 mg/L); diet cola 23 (caffeine 127 mg/L); sports drink 297 (3.9 g/100 mL, Na 21, K 4); ORS 229 (1.8 g/100 mL, Na 55, K 20); orange juice 570 (10.5 g/100 mL, Na 1, K 33); lager 774 (2.2 g/100 mL); coffee 34 (caffeine 212 mg/L); hot tea 16 and cold tea 18 (caffeine 179 mg/L); full-fat milk 286 (Na 18, K 41); skimmed milk 282 (Na 19, K 40). Participants' baseline serum osmolality was 293 (6) mmol/kg.
Caveat: Single UK commercial products from 2014; brands vary. The 275-295 mOsm/kg range often attached to this table is not in the paper: it comes from Sadowska 2017.
- Strong evidenceGuideline
NATA says the optimal carbohydrate concentration for fluid absorption is 3-8%, and that more than 5-8% may slow it.14
Carbohydrate 3-8% optimal; above 5-8% may slow absorption; 400-600 mL in the stomach works best; about 200 mL every 15-20 min; exercise above 80% VO2max may slow gastric emptying.
- Moderate evidenceRandomised trial
At a fixed 1 L volume, sparkling water produced the same urine output over 4 h as still water, so carbonation itself did not change fluid retention.1
Sparkling water osmolality 7 mmol/kg, Na 1 mmol/L; cumulative 4-h urine not different from still water.
How concentrated these drinks actually are
Osmolality is what decides how fast a drink leaves the stomach and how water moves in the gut. Blood sits at roughly 275–295 mOsm/kg15. Drinks near that range empty quickly; concentrated ones sit far above it.
| Drink | Osmolality | Spread | n |
|---|---|---|---|
| Soft drinks16Sugar 8.7 g/dL; pH 3.1. | 693mOsm/L | — | — |
| Soda17Dr Pepper | 646mOsm/kg | — | — |
| Cola, regular15Coca-Cola (label sugar 10.6%) | 632mOsm/kg | SD 1.53 | — |
| Bitter lemon17Schweppes | 627mOsm/kg | — | — |
| Cola, dark, regular18 | 614.8mOsm/kg | SD 87.4 | 35 |
| Lemon-lime soda15Sprite (sugar 10.6%) | 556mOsm/kg | SD 2.31 | — |
| Orangeade15Sugar 8.6% | 551mOsm/kg | SD 4.16 | — |
| Tonic water17Schweppes | 501mOsm/kg | — | — |
| Clear cola ('colas blancas'), regular18Reading 'colas blancas' as lemon-lime type is an interpretation, not the paper's definition. | 497.8mOsm/kg | SD 98.5 | 35 |
| Ginger ale17Schweppes | 497mOsm/kg | — | — |
| Cola, regular17Coca-Cola (10.6 g carbohydrate/100 g, pH 2.4) | 493mOsm/kg | — | — |
| Cola, regular15Pepsi (label sugar 11%) | 492mOsm/kg | SD 3.21 | — |
| Lemon-lime soda17Sprite | 479mOsm/kg | — | — |
| Orange soda17Fanta | 415mOsm/kg | — | — |
| Cola, dark, low-calorie18 | 62.6mOsm/kg | SD 9.5 | 20 |
| Clear cola, low-calorie18 | 60.8mOsm/kg | SD 10.3 | 20 |
| Diet cola15Pepsi light | 34mOsm/kg | SD 1.73 | — |
| Diet cola15Coca-Cola light | 29mOsm/kg | SD 4.73 | — |
| Diet cola17Coca-Cola light | 27mOsm/kg | — | — |
| Diet cola17Pepsi max | 27mOsm/kg | — | — |
| Diet cola17Pepsi light | 25mOsm/kg | — | — |
The bubbles change how it feels, not how it counts
Should You Worry About Caffeine Dehydrating You?
SciShow · starts at 0:10 · Watch on YouTube
SciShow explains why it is so hard to test whether caffeine dehydrates you, and where the belief may have started. It is mostly about coffee, but it ends where this page does: a few caffeinated sodas will not dehydrate you, and hydration is not the reason to cut back on them.
Nothing loads from YouTube until you press play.
The honest part
When water is still the better pick
Hydration is the one thing soda is not being criticised for here. The trade-off is everything that rides along with the fluid.
The sugar is the whole objection
A 12 fl oz can of Coca-Cola is 39 g of sugar and 140 calories; the 20 fl oz bottle is 65 g and 240. A can of Sprite is 38 g. The CDC's line on sodas, fruit drinks, sports drinks and energy drinks is that they carry calories with little nutritional value — which is a statement about nutrition, not about fluid, and it is the reason this page ends where it does.5,22,23
Swapping one can for water is the whole play
It is also a small one, and worth being honest about: swap a daily can of cola for the same volume of water and you keep the fluid — about 332 mL of it — while dropping 39 g of sugar and 140 calories. Water Goose logs both at full volume, so the chart line does not move. Only what came with the fluid does.5,2
Caffeine matters when you are stacking it
A can of Coke is 34 mg and a Diet Coke 46 mg, so soda on its own rarely takes anyone near a limit. The drinks people line up next to it are another matter: 80 mg in a small Red Bull, 114 mg in a 12 fl oz can, 200 mg in a can of Celsius. EFSA puts single doses up to 200 mg, and habitual intake up to 400 mg a day, in the no-concern range for healthy adults.3,24,25,26,27,21
Pregnancy, children and teenagers have lower figures
EFSA's caffeine figures drop to 200 mg a day in pregnancy and 3 mg per kilogram of body weight for under-18s. Soda rarely threatens either — a can of Coke is 34 mg — but a single 12 fl oz Celsius is 200 mg, which is the whole pregnancy figure in one drink.21,27
Flat soda is not a treatment for being ill
Everything measured here was measured in rested, healthy, already-hydrated adults. It says nothing about replacing fluid lost to vomiting or diarrhoea, where an oral rehydration solution is the drink actually designed for the job and where symptoms that persist are a reason to talk to a clinician rather than open another can.
If a clinician has capped your fluid, this page does not apply
Heart failure, kidney disease and some medications come with a fluid limit, and in that situation the volume of a drink matters far more than what is dissolved in it. Follow the number you were given rather than anything derived from a study in healthy young men.
Labels
What the labels say
Published panels for products people actually buy. These are label values for one flavour and package, not laboratory measurements, and none of the brands here had any involvement in this page.
| Product | Serving | Calories | Sugars | Protein | Sodium | Potassium |
|---|---|---|---|---|---|---|
| Coca-Cola5Coca-Cola Original, 12 fl oz can | 12 fl oz can | 140 | 39 g | — | — | — |
| Coca-Cola5Coca-Cola Original, 20 fl oz bottle | 1 bottle (20 fl oz) | 240 | 65 g | — | 75 mg | — |
| Coca-Cola24Diet Coke, 12 fl oz can | 1 can (12 fl oz) | 0 | 0 g | — | 40 mg | — |
| Coca-Cola28Coca-Cola Zero Sugar, 12 fl oz can | 1 can (12 fl oz) | 0 | 0 g | — | 40 mg | 60 mg |
| Sprite22Sprite (original lemon-lime), 12 fl oz can | 1 can (12 fl oz) | 140 | 38 g | — | 65 mg | — |
| Red Bull25Red Bull Energy Drink, 8.4 fl oz can | 8.4 fl oz | 110 | 26 g | 0 g | 105 mg | — |
| Red Bull26Red Bull Energy Drink, 12 fl oz can | 12 fl oz | — | — | — | — | — |
| CELSIUS27Sparkling Orange, 12 fl oz can | 12 fl oz (355 mL) | 10 | — | — | 5 mg | — |
Labels checked 2026-09-15. A dash means the label does not publish that value — it is not a zero. Formulations and panels change, so treat these as a snapshot and check the carton in your hand.
- Coca-Cola: From the product page FAQ, not a nutrition panel; sodium per 12 oz is not given.
- Coca-Cola: The caffeine FAQ gives the same 34 mg for a 12-oz can.
- Coca-Cola: Caffeine 34 mg per 12 fl oz can.
- Coca-Cola: 65 g added sugars.
- Coca-Cola: Caffeine is listed as an ingredient but not stated per 20 fl oz.
- Coca-Cola: Sweetened with aspartame; contains phenylalanine.
- Coca-Cola: Caffeine 46 mg per 1 can (12 fl oz).
- Coca-Cola: Sweetened with aspartame, acesulfame potassium and stevia extract.
- Coca-Cola: Caffeine 34 mg per 1 can (12 fl oz).
- Sprite: 38 g added sugars.
- Sprite: Label says 'no caffeine'.
- Sprite: Caffeine 0 mg per 1 can (12 fl oz).
- Red Bull: Sugar from the formal nutrition declaration; the same page's body text says 27 g.
- Red Bull: Caffeine 80 mg per 8.4 fl oz.
- Red Bull: Listed here only as a caffeine comparison. It is not a soda, and nothing on this page treats it as a way to hydrate.
- Red Bull: Caffeine 114 mg per 12 fl oz.
- Red Bull: Listed here only as a caffeine comparison. It is not a soda, and nothing on this page treats it as a way to hydrate.
- CELSIUS: The label prints carbohydrate as '0mg' and calls the drink 'not a significant source' of sugars and potassium.
- CELSIUS: Caffeine 200 mg per 12 fl oz (355 mL).
- CELSIUS: Listed here only as a caffeine comparison. It is not a soda, and nothing on this page treats it as a way to hydrate.
Caffeine, side by side
Coca-Cola, 12 fl oz: 34 mg
The brand's own caffeine FAQ gives 34 mg for a 12-ounce can of Coke and 46 mg for Diet Coke — the diet version has the most of the two.3,24
Coca-Cola Zero Sugar: 34 mg
The same as Original in a 12 fl oz can, with zero calories, zero sugar, 40 mg of sodium and 60 mg of potassium.28
Sprite: none
The label says no caffeine, and USDA's generic lemon-lime soda agrees at 0 mg. The 38 g of sugar in a can is the part worth noticing.22,2
Red Bull: 80 mg, or 114 mg in a 12 fl oz can
Roughly two to three cans of Coke in one drink. Not a soda, and not something this page treats as a way to hydrate.25,26
Celsius Sparkling Orange: 200 mg
About six cans of Coke of caffeine in one 12 fl oz can, and the drink closest to the one that scored 0.86 against water in the 2025 energy-drink trial.27
EFSA's no-concern figures: 200 mg single, 400 mg a day
For healthy adults, with 200 mg a day in pregnancy and 3 mg per kilogram for under-18s. These are safety limits, not hydration thresholds.21
Questions
Soda and hydration, question by question
Does Coke count toward your daily water intake?
Yes. It is about 89% water, and a 12 fl oz can delivers roughly 332 mL of fluid. In the trial that created the beverage hydration index, cola retained fluid no differently from still water over the two hours after drinking. Water Goose counts it at full volume, like every other drink in the app.2,1
Is Diet Coke hydrating?
It is about as close to water as a soft drink gets: 99.5% water by USDA's figures, no sugar, and 43 mg of caffeine per 12 fl oz by those same figures or 46 mg by the label. In the trial it scored 1.08 on the hydration index, which was not a significant difference from still water.2,24,1
Does Coke Zero hydrate you the same way?
No trial has tested it, so there is no measured answer. Its label is near-identical to Diet Coke's: zero calories, zero sugar, 40 mg of sodium and 34 mg of caffeine in a 12 fl oz can, plus 60 mg of potassium. Nothing in that list would be expected to behave differently from the diet cola that was tested.28,1
Is Sprite hydrating?
Yes, and it is the one in this group with no caffeine at all. USDA's lemon-lime soda is 89.5% water, so a 12 fl oz serving carries about 329 mL of fluid along with 38.2 g of sugars; a can of Sprite lists 38 g. Measured osmolality for Sprite runs 479 to 556 mOsm/kg against blood's 275-295, which is the sugar talking, not the bubbles.2,22,17,15
Is ginger ale hydrating?
It is the mildest of the group: 91.2% water, about 339 mL of fluid and 33.1 g of sugars per 12 fl oz, and no caffeine. Schweppes ginger ale measured 497 mOsm/kg in a Swiss survey. No one has run ginger ale through a hydration trial, and flat ginger ale is not a treatment for illness — an oral rehydration solution is the drink designed for that, and symptoms that persist are a reason to see a clinician rather than to open another can.2,17
Can the caffeine in cola pull out more fluid than the drink puts in?
Not at these doses. A measurable diuretic effect needs roughly 250-300 mg of caffeine in one go, and a 12 fl oz can of Coke has 34 mg. When the same research group varied caffeine from 0 to 400 mg per litre while holding everything else steady, urine output did not change at all (P = 0.83).4,3,6
Is cola a good choice after exercise or in the heat?
No evidence says it beats water there. The trial behind these numbers used rested, already-hydrated people drinking a litre at a sitting, which is the opposite of replacing sweat. Drinks in the 3-8% carbohydrate range are absorbed best, and cola is about 10.6%. If you are losing serious fluid, the sweat rate calculator linked below works out what you actually lost.1,14
Could you drink only soda and be fine on fluid?
On fluid alone, largely — but that is not the interesting part. At about 39 g of sugar and 140 calories a can, the CDC's view of sodas, fruit drinks, sports drinks and energy drinks is that they carry calories with little nutritional value. Soda counts toward your intake; water costs nothing; swapping one can a day is the version of this that survives real life.5,23
Receipts
Sources and how we compiled this
Where the composition comes from
U.S. Department of Agriculture, Agricultural Research Service. FoodData Central. Built 2026-09-15 from the published CSV releases, never hand-typed.
- Food and Nutrient Database for Dietary Studies (FNDDS) · 2024-10-31
- SR Legacy · 2018-04
- — Drinks and prepared foods use FNDDS (foods and drinks as consumed) whenever FNDDS has a code for the item.
- — Raw produce and dairy foods use Foundation Foods when the entry is current (listed in foundation_food.csv), stands for the food generally rather than one cultivar or colour, and reports water, energy and potassium, plus fiber for plant foods. Otherwise SR Legacy.
- — A Foundation pick with no household portions uses the portions of the SR Legacy entry for the same food (portionsSource).
- — Fluid milks use FNDDS, whose composition matches the Foundation analyses (crossCheck) and which has consistent drink portions.
- — SR Legacy fills any remaining gap. No proxy is used where USDA has no sensible entry (see missing).
What this evidence cannot tell you
- — The Beverage Hydration Index measures short-term retention, not 24-h hydration: for each person it is urine after still water divided by urine after the test drink, anchored 2 h after drinking 1 L over 30 min.
- — Most participants were young, healthy, euhydrated, fasted, rested men given a single 1 L dose. Older adults retain more water and respond differently.
- — Post-exercise retention percentages come from dehydrated people drinking 100-150% of the body mass they lost. They are not comparable to BHI values and must not share a scale with them.
- — Clarke 2019 reports mean ± SEM while most studies report SD, so spreads are not directly comparable.
- — No resting BHI data were found for soup, smoothie, lemonade or coconut water. Energy-drink evidence comes from one modified-protocol study, and soda evidence is cola and diet cola from Maughan 2016 only.
- — Many of these studies are industry funded: the European Hydration Institute, Entrinsic, Dairy Management, Nuun, Coca-Cola, Buoy, Lingtea, QCK, the Almond Board, 8 POiNT, VitaCoco, Liquid I.V., Innate-Essence and ITO EN all appear as funders.
- — Commercial formulations change over time. Compositions are as measured or labelled at the time of each study and are not current labels.
Who paid for the research
Hydration research is heavily industry funded. That does not make a study wrong, but you should know who paid before you weigh it. Water Goose took no money from anyone named here, and no brand saw this page before it went up.
- — Maughan 2016: Funded by a grant from the European Hydration Institute (EHI). Prof Maughan chairs the EHI Scientific Advisory Board (not the Institute itself); Dr Watson has also received EHI funding.
- — Takamata 2026: Funded by ITO EN, Ltd.; seven of the thirteen authors are ITO EN employees.
- — Millard-Stafford 2025: Funded by Liquid-IV, a Unilever company (grant GR00027334), maker of the Liquid I.V. Energy Multiplier that matched water in the trial. A Liquid IV principal scientist helped conceptualise and review the manuscript. The first author has also had funding from Coca-Cola, Kraft and Liquid IV.
- — Killer 2014: Funded by ISIC.
- — Passe 1997: Authors affiliated with the Gatorade Sports Science Institute, Barrington, IL.
References
Every number on this page points at one of these. Product labels were checked 2026-09-15.
- 1
Maughan RJ, Watson P, Cordery PAA, Walsh NP, Oliver SJ, Dolci A, Rodriguez-Sanchez N, Galloway SDR. A randomized trial to assess the potential of different beverages to affect hydration status: development of a beverage hydration index. Am J Clin Nutr 2016;103(3):717-723.
StudyRead: full textOpen source
Funding: Funded by a grant from the European Hydration Institute (EHI). Prof Maughan chairs the EHI Scientific Advisory Board (not the Institute itself); Dr Watson has also received EHI funding.
Read from the LJMU green open-access accepted manuscript (https://researchonline.ljmu.ac.uk/id/eprint/12468/); the publisher page was blocked. ISRCTN13014105.
- 2
U.S. Department of Agriculture, Agricultural Research Service. FoodData Central (SR Legacy and Foundation Foods).
DatasetRead: official pageOpen source
Water content is not the same thing as a net hydration effect.
- 3
Coca-Cola US. What is caffeine? (FAQ).
Product labelRead: official pageOpen source
- 4
Maughan RJ, Griffin J. Caffeine ingestion and fluid balance: a review. J Hum Nutr Diet 2003;16(6):411-420.
StudyRead: abstractOpen source
Narrative review; the source of Maughan 2016's 250-300 mg threshold.
- 5
Coca-Cola US. Coca-Cola Original product page, nutrition facts and FAQ.
Product labelRead: official pageOpen source
The only 12 fl oz panel on this page belongs to Coca-Cola Caffeine Free; 12 oz figures for Original come from the page FAQ.
- 6
Maughan RJ, Watson P, Cordery PAA, Walsh NP, Oliver SJ, Dolci A, Rodriguez-Sanchez N, Galloway SDR. Sucrose and sodium but not caffeine content influence the retention of beverages in humans under euhydrated conditions. Int J Sport Nutr Exerc Metab 2019;29(1):51-60.
StudyRead: abstractOpen source
Abstract describes a double-blind crossover design. Numeric BHI values are not in the abstract. Peden 2024 describes the sucrose result differently (only the 20% drink raising BHI).
- 7
Clayton DJ, Evans GH, James LJ. Effect of drink carbohydrate content on postexercise gastric emptying, rehydration, and the calculation of net fluid balance. Int J Sport Nutr Exerc Metab 2014;24(1):79-89.
StudyRead: abstractOpen source
- 8
Takamata A, Kosugi N, Sakagawa N, et al. Effects of Carbonated and Electrolyte-Added Water on Body Fluid Regulation and Ingestive Behavior During Ad Libitum Rehydration Following Mild Hypohydration. Nutrients 2026;18(12):1846.
StudyRead: full textOpen source
Funding: Funded by ITO EN, Ltd.; seven of the thirteen authors are ITO EN employees.
- 9
Millard-Stafford M, Hack B, Harp A, Smith E. Caffeinated Energy Drink Formulations Differentially Impact Hydration Versus Water: Does Habitual Caffeine Intake or Biological Sex Matter? Nutrients 2025;17(18):2913.
StudyRead: full textOpen source
Funding: Funded by Liquid-IV, a Unilever company (grant GR00027334), maker of the Liquid I.V. Energy Multiplier that matched water in the trial. A Liquid IV principal scientist helped conceptualise and review the manuscript. The first author has also had funding from Coca-Cola, Kraft and Liquid IV.
Modified protocol: 500 mL of test drink plus 500 mL of water, not 1 L of drink.
- 10
Grandjean AC, Reimers KJ, Bannick KE, Haven MC. The effect of caffeinated, non-caffeinated, caloric and non-caloric beverages on hydration. J Am Coll Nutr 2000;19(5):591-600.
StudyRead: abstractOpen source
- 11
Zhang Y, Coca A, Casa DJ, Antonio J, Green JM, Bishop PA. Caffeine and diuresis during rest and exercise: a meta-analysis. J Sci Med Sport 2015;18(5):569-574.
StudyRead: full textOpen source
Caffeine sources in the pooled studies were mixed: pills, tea, coffee and caffeinated beverages.
- 12
Killer SC, Blannin AK, Jeukendrup AE. No evidence of dehydration with moderate daily coffee intake: a counterbalanced cross-over study in a free-living population. PLoS One 2014;9(1):e84154.
StudyRead: full textOpen source
Funding: Funded by ISIC.
- 13
Vist GE, Maughan RJ. The effect of osmolality and carbohydrate content on the rate of gastric emptying of liquids in man. J Physiol 1995;486(Pt 2):523-531.
StudyRead: abstractOpen source
Values are mean ± SEM.
- 14
McDermott BP, Anderson SA, Armstrong LE, et al. National Athletic Trainers' Association Position Statement: Fluid Replacement for the Physically Active. J Athl Train 2017;52(9):877-895.
GuidelineRead: full textOpen source
- 15
Sadowska A, Świderski F, Rakowska R, Waszkiewicz-Robak B, Żebrowska-Krasuska M, Dybkowska E. Beverage osmolality as a marker for maintaining appropriate body hydration. Rocz Panstw Zakl Hig 2017;68(2):167-173.
StudyRead: full textOpen source
Polish market products. This is the source of the 275-295 mOsm/kg range (it describes the isotonic drinks tested), not Maughan 2016.
- 16
Chavalittamrong B, Pidatcha P, Thavisri U. Electrolytes, sugar, calories, osmolarity and pH of beverages and coconut water. Southeast Asian J Trop Med Public Health 1982;13(3):427-431.
StudyRead: abstractOpen source
Values are osmolarity in mOsm/L.
- 17
Mettler S, Rusch C, Colombani PC. Osmolality and pH of sport and other drinks available in Switzerland. Schweiz Z Sportmed Sporttraumatol 2006;54(3):92-95.
StudyRead: full textOpen source
Products bought November 2005; freezing-point osmometer, duplicate readings.
- 18
Dini E, De Abreu J, López E. Osmolalidad de bebidas de consumo frecuente [Osmolality of frequently consumed beverages]. Invest Clin 2004;45(4):323-335.
StudyRead: full textOpen source
Venezuelan products, 2002-2003; vapour-pressure osmometer. Its 'natural' fruit drinks are lab blends of pulp diluted with water, not 100% juice (only the orange juice was undiluted).
- 19
Passe DH, Horn M, Murray R. The effects of beverage carbonation on sensory responses and voluntary fluid intake following exercise. Int J Sport Nutr 1997;7(4):286-297.
StudyRead: abstractOpen source
Funding: Authors affiliated with the Gatorade Sports Science Institute, Barrington, IL.
- 20
Wakisaka S, Nagai H, Mura E, Matsumoto T, Moritani T, Nagai N. The effects of carbonated water upon gastric and cardiac activities and fullness in healthy young women. J Nutr Sci Vitaminol 2012;58(5):333-338.
StudyRead: abstractOpen source
- 21
EFSA NDA Panel. Scientific Opinion on the safety of caffeine. EFSA Journal 2015;13(5):4102.
GuidelineRead: official pageOpen source
Figures are from EFSA's caffeine topic page; the full opinion returned 403. These are safety limits, not hydration thresholds.
- 22
Coca-Cola US. Sprite products, nutrition facts.
Product labelRead: official pageOpen source
- 23
Centers for Disease Control and Prevention. Water and Healthier Drinks. Last reviewed 5 March 2026.
GuidelineRead: official pageOpen source
Read through a summarising fetch tool; do a verbatim check before quoting its wording.
- 24
Coca-Cola US. Diet Coke products, nutrition facts.
Product labelRead: official pageOpen source
- 25
Red Bull US. Red Bull Energy Drink ingredients list and nutrition declaration (8.4 fl oz).
Product labelRead: official pageOpen source
The page body says 27 g sugars; its formal declaration and comparison graphic say 26 g. brands.ts uses the declaration.
- 26
Red Bull US. How much caffeine is in a can of Red Bull Energy Drink?
Product labelRead: official pageOpen source
- 27
CELSIUS. Sparkling Orange, 12 fl oz can label and Essential Facts FAQ.
Product labelRead: official pageOpen source
- 28
Coca-Cola US. Coca-Cola Zero Sugar, nutrition facts.
Product labelRead: official pageOpen source
- 29
EFSA Panel on Dietetic Products, Nutrition, and Allergies (NDA). Scientific Opinion on Dietary Reference Values for water. EFSA Journal 2010;8(3):1459.
GuidelineRead: full textOpen source
Read from the DTU Orbit copy of the published PDF; Wiley was blocked.
- 30
Institute of Medicine. Dietary Reference Intakes for Water, Potassium, Sodium, Chloride, and Sulfate. Chapter 4: Water. Washington, DC: The National Academies Press; 2005.
GuidelineRead: full textOpen source
Cite this directly for adequate intakes: Maughan 2016's introduction misstates the women's figure. On alcohol it concludes the diuresis is transient; it makes no explicit 'all drinks count equally' statement.
How we compiled this
Other drinks, measured
- Every drink, measured against waterThe whole index in one chart, with the composition of all 23 drinks underneath.
- Does milk hydrate you?The drink that did beat water on the same index, and by how little it matters.
- Does Gatorade hydrate you?The drink built around sodium, and when it earns its sugar.
- Does orange juice hydrate you?Juice and lemonade: the same sugar question without the caffeine.
Free tools
- Caffeine calculatorHow much caffeine is still in you at bedtime, drawn as a decay curve — plus where you are against the daily limit.
- Water intake calculatorYour daily target from weight, activity, climate and altitude — shown in ounces, millilitres, litres, cups and bottles at once.
- Sweat rate calculatorWeigh in, train, weigh out. Get your litres-per-hour, your fluid deficit, and how much to drink per hour next time.
This page describes what studies measured in healthy adults. It is general wellness information, not medical advice, diagnosis or treatment. Fluid needs change with health conditions, medication and pregnancy — and some conditions require drinking less. Talk to a clinician about yours.
Keep the number
One can swapped for water is the whole experiment — same fluid, 39 g less sugar. Water Goose logs soda and water side by side at full volume, so you can see which one you actually reached for.
Free on iPhone and Android. Water Goose Plus unlocks saving and customising.