Sports drinks, oral rehydration solutions and electrolyte mixes
Does Gatorade hydrate you?
Hydrates - but no better than water at rest
Yes, and no better than water. In the only trial that has measured thirteen drinks head to head, a sports drink scored 1.02 against water's 1.00 - a gap far too small to mean anything. What changes the answer is the situation rather than the drink: long sessions, heat and heavy sweating, where the sodium in it starts to matter.1
Last reviewed 38 sourcesWritten from the studies, not from other websites
The measurement
Sports drinks, measured against water
Only one trial has put a sports drink next to twelve other drinks under identical conditions. Seventy-two healthy men drank a litre of one of them over thirty minutes, sat still, and gave urine samples every hour for four hours. The beverage hydration index is what came out of it: urine passed after plain water divided by urine passed after the test drink, two hours after the last sip, so anything above 1.00 means more of it stayed in you. The sports drink - Powerade as sold in the UK in 2014, with 21 mmol/L of sodium and 3.9 g of carbohydrate per 100 mL - came out at 1.02, and 0.98 once it is corrected for its own water content. The oral rehydration solution scored 1.54, one of only four drinks that beat water at all, alongside skimmed milk at 1.58 and full-fat milk at 1.50.
- Skimmed milk1.58
- Oral rehydration solution1.54
- Full-fat milk1.50
- Orange juice1.39
- Cola1.23
- Diet cola1.08
- Cold black tea1.07
- Hot black tea1.03
- Sports drink1.02
- Still waterreference1.00
- Lager0.99
- Sparkling water0.98
- Coffee (hot, black)0.91
Significance as marked on the paper’s Figure 2: ** P<0.01, * P<0.05 vs waterWhiskers are 1 SD
Show the data tableHide the data table
| Drink | Index2 h | Correctedwater content | SD | vs water | n |
|---|---|---|---|---|---|
| Skimmed milkTesco, 0.1% fat | 1.58 | 1.44 | 0.60 | Above water | 17 |
| Oral rehydration solutionDioralyte, made up with Highland Spring water | 1.54 | 1.50 | 0.74 | Above water | 17 |
| Full-fat milkTesco, 3.6% fat | 1.50 | 1.32 | 0.58 | Above water | 17 |
| Orange juiceTesco Everyday Value | 1.39 | 1.24 | 0.64≈ | Above water | 16 |
| ColaCoca-Cola | 1.23 | 1.09 | 0.54≈ | No detected difference | 17 |
| Diet colaDiet Coke | 1.08 | 1.08 | 0.24≈ | No detected difference | 16 |
| Cold black teaPG tips | 1.07 | 1.07 | 0.59≈ | No detected difference | 17 |
| Hot black teaPG tips | 1.03 | 1.03 | 0.24≈ | No detected difference | 15 |
| Sports drinkPowerade | 1.02 | 0.98 | 0.24≈ | No detected difference | 17 |
| Still waterHighland Spring | 1.00 | 1.00 | — | Reference drink | 72 |
| LagerCarling | 0.99 | 0.94 | 0.31≈ | No detected difference | 17 |
| Sparkling waterHighland Spring | 0.98 | 0.98 | 0.20≈ | No detected difference | 17 |
| Coffee (hot, black)Nescafe Original instant | 0.91 | 0.90 | 0.31≈ | No detected difference | 17 |
≈ marks a standard deviation read from the paper’s figures rather than its text. “Corrected” adjusts each drink for its own water content, which is the fairer comparison and the one that moves orange juice below significance.
What this number is not
- — About 17 drinkers per test drink against a pooled water arm, so small differences such as coffee vs water cannot be detected.
- — Rested, already-hydrated young men drinking 1 L in 30 min; the result describes a 2-4 h window, not all-day hydration.
- — Caffeine at 96-212 mg in these drinks had no effect on net fluid balance. The authors cite a threshold of about 250-300 mg for a measurable diuretic effect (Maughan & Griffin 2003).
- — The lager's alcohol content was not reported, and no numeric 4-h BHI was reported for any drink.
- — Nine of the twelve BHI standard deviations, and eight of the twelve means, are only in the figures; they were read from the figure's vector data and match the text values to about 0.01.
- — The abstract says the BHI was corrected for water content, but the 1.58, 1.54 and 1.50 values are the uncorrected BHI.
So, is Gatorade more hydrating than water?
Can the Beverage Hydration Index be used to decide what drink is best? - Stuart Galloway
IOC Diploma Sports Nutrition · starts at 0:07 · Watch on YouTube
Stuart Galloway co-wrote the trial behind this page's 1.02. In under a minute he explains that the index was measured in rested, already-hydrated people, so it cannot tell you what to drink mid-session, when you want fluid delivered fast rather than held.1
Where the video goes further than the evidence
Nothing loads from YouTube until you press play.
The rest of the evidence
What the other studies found
The index above is one protocol run in one set of laboratories. Eight other teams have measured much the same thing - in older adults, in athletes, with tablets and drops and amino acids in place of sugar - and they do not entirely agree. The differences are mostly in the protocol rather than the drinks, so each card below says who drank what, over what window, and who paid for it.
Sollanek 20184
At restHydration index40 euhydrated, fasted adults (17 men, 23 women). Standard 1 L BHI protocol per the abstract; repeated-measures comparison of water, an amino-acid ORS, a glucose ORS and a sports drink.
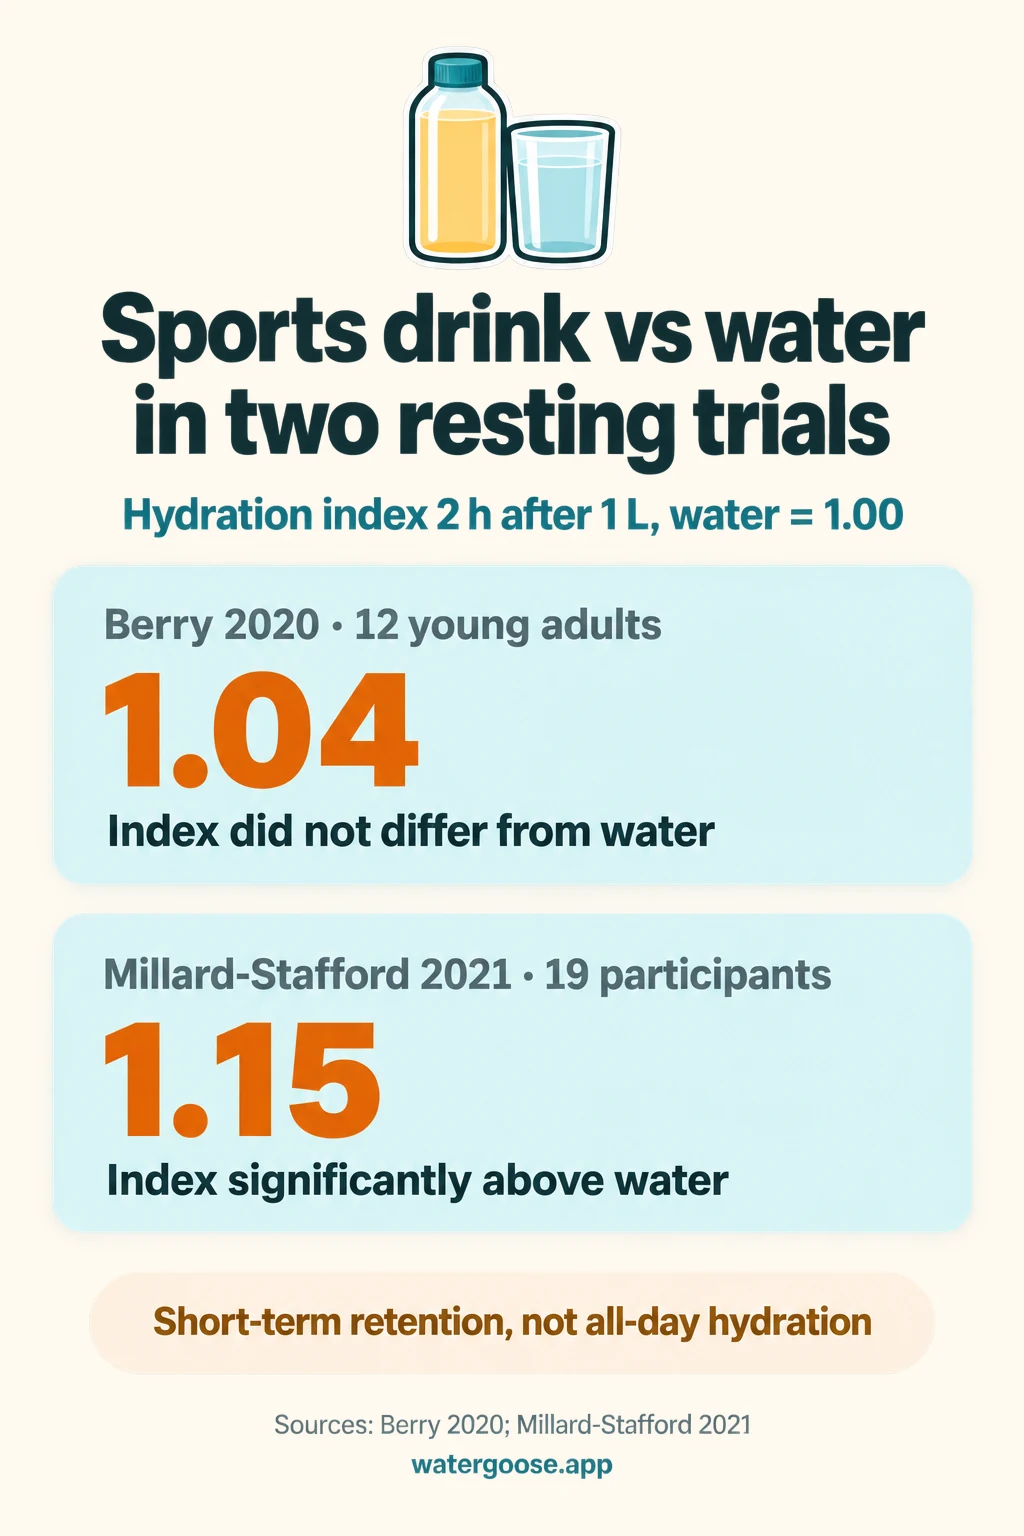
What each group drank in Sollanek 2018, and what was measured Waterreference Not reported in the abstract Amino-acid oral rehydration solution (AA-ORS) 1.15 (SD 0.28)Not in the abstract; a later paper (Millard-Stafford 2021) reports about 55 mmol/L sodium. Glucose oral rehydration solution (G-ORS) 1.21 (SD 0.28)Not in the abstract; a later paper (Bechke 2022) reports osmolality of about 267 mmol/kg and says the effect persisted to 240 min. Sports drink 1.09 (SD 0.26)Not reported in the abstract. Both oral rehydration solutions, but not the sports drink, gave a BHI above water. Body mass and sex did not influence the BHI.
- — Abstract only; composition and time window are not verified beyond it.
Clarke 20195
At restHydration index12 young (23 ± 3 y; 7 men, 5 women) and 12 older adults (67 ± 6 y; 5 men, 7 women). Randomised crossover; 1 L of distilled water or test drink over 30 min; urine at 0, 60, 120, 180 and 240 min. Label composition, measured osmolality.
What each group drank in Clarke 2019, and what was measured Distilled waterreference Young adults' 4-h urine 1443.1 ± 97.0 g (SEM). Time in positive fluid balance: young 73.6 min, older 118.0 min. G-20Gatorade BHI significantly above 1.0 at 2 and 4 h in both age groups (values in figures only). Time in positive fluid balance: young 94.7 min, older 156.5 min. AA-30enterade Advanced Oncology formula 1.2 (SEM 0.13)Highest BHI in older adults. Time in positive fluid balance: young 88.4 min, older 147.0 min. G-45Pedialyte BHI significantly above 1.0 at 2 and 4 h in both age groups (values in figures only). Time in positive fluid balance: young 73.2 min, older 152.2 min. AA-60enterade Anti-Diarrheal formula 1.24 (SEM 0.1)Highest BHI in young adults. Young 4-h urine 1228.7 ± 108.9 g vs water 1443.1 ± 97.0 g. Time in positive fluid balance: young 103.9 min, older 124.7 min. Every test drink had a BHI significantly above 1.0 at both 2 and 4 h in young and older adults. Older adults retained more fluid overall, and the authors suggest a 4-h BHI for older people.
- — Mean ± SEM, not SD; do not compare spreads with SD-based studies.
- — n=12 per age group; most per-drink BHI values are only in raster figures.
- — Partly funded by Entrinsic Health Solutions.
Funding: Partially funded by an unrestricted gift from Entrinsic Health Solutions.
Wolf 20196
At restFluid retainedSame participants and trials as Clarke 2019 (12 young, 12 older adults). 1 L over 30 min; fluid retention over 4 h.
What each group drank in Wolf 2019, and what was measured Waterreference Lowest retention in both age groups. Gatorade Na 0.460 g/L; K 0.125 g/L ENT-5 (enterade, 5 amino acids) Na 0.736 g/L; K 0.390 g/L Pedialyte Na 1.035 g/L; K 0.780 g/L ENT-8 (enterade, 8 amino acids) Na 1.380 g/L; K 0.780 g/L Water had the lowest retention in both age groups. Older adults retained more than young adults for every drink except ENT-8 at 4 h (P=0.73).
- — Retention values are in figures only.
- — The abstract's sodium values for Pedialyte and ENT-5 are swapped; the Methods values above agree with Clarke 2019.
Berry 20207
At restHydration index12 young adults (6 men, 6 women; about 23 y). Randomised crossover; 1 L at 16-20 C over 30 min; BHI at 120 and 240 min.
What each group drank in Berry 2020, and what was measured Waterreference 4-h urine 1423 ± 277 mL Carbohydrate-electrolyte sports drink (CES) 1.04 (SD 0.09) at 2 h4-h urine 1332 ± 234 mL. Cumulative urine was lower than water at 120, 180 and 240 min (p≤0.03), although its BHI never differed from water. Milk permeate-based solution (MPS) 1.29 (SD 0.15) at 2 hHigher than water and the sports drink at all time points. 4-h urine 1191 ± 194 mL. The milk permeate drink retained more fluid than water and the sports drink; the sports drink's BHI did not differ from water.
- — n=12; mean substitution for 2 missing trials.
- — Funded by Dairy Management Inc.
Funding: Funded by Dairy Management Inc.
Millard-Stafford 20218
At restHydration index19 participants (15 men, 4 women). Randomised crossover; 1 L at 10-12 C over 30 min; 240 min. Composition measured after the study; Na and K headers read 'mmol' with no volume.
What each group drank in Millard-Stafford 2021, and what was measured Deionised waterreference Osmolality 2.2 mOsm/kg; Na 0.3, K 0.5 mmol; 0 kcal Electrolyte water (E) 1.12 (SD 0.24) at 2 hOsmolality 87.6 mOsm/kg; Na 21.7, K 3.1 mmol; 0 kcal; Mg 5.1 mg/L, Ca 12.9 mg/L, vitamins Carbohydrate-electrolyte drink (C+E) 1.15 (SD 0.17) at 2 hSignificant vs water at 120, 180 and 240 min (p=0.007, 0.018, 0.006). Not different from E or AG+E. Alanyl-glutamine + electrolytes (AG+E) 1.14 (SD 0.2) at 240 minSignificant vs water at 240 min only. Adding carbohydrate to about 21 mmol/L electrolytes raised BHI above water from 120 min; electrolytes alone did not reach significance; no differences among the three test drinks.
- — Mostly men.
- — Funded by Coca-Cola.
Funding: Funded by Coca-Cola.
Yun 20229
At restHydration indexMale athletes (36 recruited; 31 observations analysed). Crossover; 1 L over 30 min; hourly urine for 4 h; BHI.
What each group drank in Yun 2022, and what was measured Waterreference Cumulative urine 638 g (1 h), 959 ± 271.7 g (2 h), 1110 g (3 h), 1189 ± 293.6 g (4 h). Oral rehydration solutionLingtea Cumulative urine 543 g (1 h), 791 ± 217.5 g (2 h), 893 g (3 h), 956 ± 230.6 g (4 h). Retained more than SpD2 at 3 and 4 h. Sports drink 1 (SpD1)Lingtea Cumulative urine 486 g (1 h), 771 ± 209.0 g (2 h), 928 g (3 h), 1001 ± 230.3 g (4 h). Sports drink 2 (SpD2)Otsuka Pharmaceutical Cumulative urine 557 g (1 h), 830 ± 183.5 g (2 h), 978 g (3 h), 1057 ± 215.2 g (4 h). All three drinks gave a higher BHI than water from 2 h onwards (BHI values shown only in figures).
- — Male athletes only.
- — Ratios of group-mean urine are not individual-level BHI, so none are given here.
- — Funded by Lingtea, which makes the ORS and SpD1.
Funding: Grants from Lingtea Co., Ltd., which makes the oral rehydration solution and one of the sports drinks tested.
Bechke 202210
At restHydration index22 adults (50% women). Crossover; 1 L over 30 min; 240 min; control was distilled water (Deer Park).
What each group drank in Bechke 2022, and what was measured Distilled waterreference Cumulative urine 0.6327 L (60 min), 1.094 L (120), 1.292 L (180), 1.405 L (240). Isotonic beverageHOIST 1.06 (SD 0.15) at 2 hCumulative urine 0.6157 L (60 min), 1.043 L (120), 1.202 L (180), 1.299 L (240). Net fluid balance higher than water by 90 mL at 180 min and 106 mL at 240 min. The isotonic drink did not differ from water at 2 h but retained more at 3 and 4 h.
- — Funded by QCK, LLC, the maker of HOIST.
Funding: Funded by QCK, LLC (grant 20-0081), the maker of HOIST.
Pence 202011
At restHydration index18 active adults (8 men, 10 women). Crossover; 1 L over 30 min; 4-h urine; BHI.
What each group drank in Pence 2020, and what was measured Waterreference Body mass loss 0.57 kg Nuun, single doseNuun (3 tablets in 1.4 L; 1 L drunk) BHI above water in planned contrasts at 2 h (p=0.05) and 4 h (p=0.02), with non-significant omnibus tests (p=0.13 and 0.06). Body mass loss 0.38 kg (p=0.02 vs water). Nuun, double doseNuun (6 tablets in 1.4 L) 4-h contrast vs water p=0.09. Body mass loss 0.43 kg (p=0.08). Fluid balance was better than water for both doses at 2, 3 and 4 h (p≤0.04). A double dose did not improve BHI further than a single dose.
- — BHI values are in figures only.
- — Funded in part by Nuun.
Funding: Provided in part by Nuun & Company, Inc., and the University of Memphis.
Boyd-Shiwarski 202512
At restHydration indexDifferent protocol30 adults (14 men, 16 women; 18-45 y). Non-randomised, fixed order (Buoy, then water, then Nuun). Water and Buoy: 1 L sipped at a metered rate over 4 h. Nuun: 1 L over 30 min. 6-h urine collection. Mean ± SD in the text; figure error bars are 95% CI.
What each group drank in Boyd-Shiwarski 2025, and what was measured Water, metered over 4 hreference Fluid balance at 360 min -0.05 ± 0.32 L. Electrolyte drops, metered over 4 hBuoy (18 mL/L) 1.64 (SD 0.75) at 360 minRetained more than water sipped the same way. Fluid balance at 360 min +0.28 ± 0.28 L. Electrolyte tablets, 1 L over 30 minNuun Sport (2 tablets/L) 1.11 (SD 0.37) at 360 minFluid balance at 360 min +0.03 ± 0.20 L. Electrolyte drops sipped over 4 h retained more fluid than water sipped the same way; the comparison with the Nuun bolus is confounded by the different drinking patterns.
- — Non-randomised, non-standard drinking pattern and a 6-h window.
- — Buoy paid for part of two authors' time.
Funding: Buoy paid for part of two authors' time.
The pattern, such as it is
Composition
What is actually in a glass
Each variant on one scale, with water as the baseline. Switch the serving to whichever glass you actually drink from.
Serving size
Showing 500 mL · 16.9 fl oz of each.
| Drink | Waterby weight | Water in itper serving | Calories | Sugars | Protein | Sodium | Potassium | Calcium |
|---|---|---|---|---|---|---|---|---|
 Sports drinkFDC 2710771 Sports drinkFDC 2710771 | 93.4% | 489mL16.5 fl oz | 136kcal | 27.5g | 0g | 204mg | 79mg | 5mg |
| Sports drink, low calorieFDC 2710774 | 97.9% | 497mL16.8 fl oz | 41kcal | 6.6g | 0.3g | 228mg | 66mg | 0mg |
 Oral rehydration solutionFDC 2710775 Oral rehydration solutionFDC 2710775 | 96.4% | 505mL17.1 fl oz | 52kcal | 12.8g | 0g | 529mg | 404mg | 52mg |
 Water (for comparison)FDC 2710707 Water (for comparison)FDC 2710707 | 99.9% | 507mL17.1 fl oz | 0kcal | 0g | 0g | 20mg | 0mg | 15mg |
USDA publishes composition per 100 grams, so each serving is converted through the item's own density - about 1.0482 g/mL for a sports drink, which is why a 12 fl oz bottle weighs 372 g but delivers about 347 mL of water. Those densities come from rounded household portion weights, so treat them as good to a couple of percent. The oral rehydration solution has only one USDA household portion, a single fluid ounce, so its density comes from that. All four rows are caffeine-free in USDA's data, and those zeros are real values rather than missing ones.3
Which USDA entries these areHide the USDA entries
- Sports drink: Sports drink, NFS — FDC 2710771, Food and Nutrient Database for Dietary Studies (FNDDS) 2024-10-31
- Sports drink, low calorie: Sports drink, low calorie — FDC 2710774, Food and Nutrient Database for Dietary Studies (FNDDS) 2024-10-31
- Oral rehydration solution: Fluid replacement, electrolyte solution — FDC 2710775, Food and Nutrient Database for Dietary Studies (FNDDS) 2024-10-31
- Water (for comparison): Water, tap — FDC 2710707, Food and Nutrient Database for Dietary Studies (FNDDS) 2024-10-31
Your glass
Your glass, counted
Pick a drink and a size to see the water it delivers, what it costs you in calories and sugar, and where it lands against your daily goal.
500 mL · 16.9 fl oz
68 fl oz. Not sure? The intake calculator works it out from your weight.
500 mL of sports drink delivers
489mL of water
16.5 fl oz · 93.4% water by weight
Counted as volume rather than water content, it is 25% of the goal, which is how Water Goose logs it: the whole glass, with no hydration multiplier. The guidance is making a narrower point: EFSA and NASEM both count the water a drink carries toward your total intake, rather than the volume of the glass. This page explains the science; the app keeps the logging simple.37,38
- Calories
- 136kcal
- Sugars
- 27.5g
- Protein
- 0g
- Sodium
- 204mg
- Potassium
- 79mg
- Calcium
- 5mg
In Water Goose a sports drink, sugar-free or not, logs as Sports drink at full volume. There is no oral rehydration solution preset - Sports drink is the closest - and no preset for a powder or a tablet, so log the water you mixed it into as Water.
Composition from USDA FoodData Central, converted through each drink’s density.3 Work out your daily goal
Mechanism
Why it holds water (or doesn't)
A sports drink is not doing anything clever. Sodium is the lever, carbohydrate is a slower second lever, and a standard bottle sits at the bottom of the useful range for both. Two of the findings below are also a warning about the measurement itself: less urine is not always more hydration.
- Moderate evidenceRandomised trial
At rest and already hydrated, drinks with 27 or 52 mmol/L of sodium produced less urine and better net fluid balance than drinks with 7 or 15 mmol/L.13
27 and 52 mmol/L vs 7 and 15 mmol/L sodium (p<.05); 1 L drinks; 4 h.
Caveat: Abstract only.
- Moderate evidenceRandomised trial
After exercise, the share of a drink the body kept rose with its sodium content, and only the saltiest drinks returned people to fluid balance.14
n=6, 1.9% body mass lost, drank 1.5 times the loss (2045 ± 45 mL). Net fluid balance at 5.5 h: sodium 2 mmol/L -689 (124) mL; 26 mmol/L -359 (87); 52 mmol/L -2 (79); 100 mmol/L +98 (67). Values in brackets are SEM. 52 mmol/L is about 1.2 g of sodium per litre.
Caveat: Abstract only; n=6. This sodium level is well above typical sports drinks.
- Moderate evidenceRandomised trial
Drink volume and sodium interact: you must drink more than you sweated to rebalance fluids, but without enough sodium the extra volume just becomes urine.15
Low sodium 23 mmol/L vs high sodium 61 mmol/L; volumes 50, 100, 150 and 200% of the 2.06% body mass lost. Median urine over 7.5 h, low sodium: 493 mL at 100%, 867 mL at 150%, 1361 mL at 200%. High sodium: 260, 602 and 1001 mL.
Caveat: Abstract only.
- Moderate evidenceRandomised trial
Both carbohydrate content and osmolality slow how fast a drink leaves the stomach, and carbohydrate content matters more. A concentrated glucose drink took several times longer to empty than a dilute one.16
600 mL test drinks, n=6. Half-emptying time: 40 g/L glucose (230 mosmol/kg) 17 ± 1 min; 40 g/L glucose polymer (42 mosmol/kg) 14 ± 1 min; 188 g/L glucose polymer (237 mosmol/kg) 64 ± 8 min; 188 g/L glucose (1300 mosmol/kg) 130 ± 18 min. Values are mean ± SEM.
Caveat: Abstract only. 188 g/L is about 18.8% carbohydrate, roughly twice a typical cola.
- Moderate evidenceRandomised trial
After exercise, a hypertonic 10% glucose drink left much more fluid sitting in the stomach than a 2% drink, which explains part of its lower early urine output.17
n=8, about 1.8% body mass lost, drank 150% of the loss. At 120 min, 0.3% of the 2% drink and 42.1% of the 10% drink remained in the stomach (p<.001). Retained at 240 min 52% vs 64%. Once gastric residue was accounted for, net fluid balance was better with the 2% drink at 60 and 120 min.
Caveat: Abstract only.
- Weak evidenceRandomised trial
Adding electrolytes alone, at sports-drink levels, did not consistently raise the beverage hydration index above water. Combining them with carbohydrate, or with a dipeptide, did increase retention.8
n=19. Carbohydrate plus electrolytes 1.15 ± 0.17 at 120 min (p=0.007); alanyl-glutamine 2 g/L plus electrolytes 1.15 ± 0.20 at 240 min (p=0.021). Electrolytes alone gave the largest absolute net effect (over 12%) but were not significantly different from water.
Caveat: Funded by Coca-Cola; mostly men.
How concentrated these drinks actually are
Osmolality is what decides how fast a drink leaves the stomach and how water moves in the gut. Blood sits at roughly 275–295 mOsm/kg36. Drinks near that range empty quickly; concentrated ones sit far above it.
| Drink | Osmolality | Spread | n |
|---|---|---|---|
| Carbohydrate-electrolyte sports drink8Test drink 'C+E', 5.8% carbohydrate | 441.8mOsm/kg | SD 0.8 | — |
| Oral rehydration drink, premixed32Speedlyte, wild orangeFive bottles measured 406-410 mmol/kg; the manufacturer claims 188. | 406mOsm/kg | — | — |
| Sports drink33Gatorade Thirst QuencherNa 19, K 3, Cl 12 mmol/L (measured); 60 g/L carbohydrate (manufacturer). | 343mOsm/kg | unspecified 33 | — |
| Sports drink32Gatorade orange, premixedReported as about 334 mmol/kg. Rose by 108 mmol/kg after 60 days at about 31 C, the largest rise of any product tested. | 334mOsm/kg | — | — |
| Carbohydrate-electrolyte sports drink76% carbohydrate, Na 20 mmol/L | 326mOsm/kg | SD 3 | — |
| Oral rehydration solution, premixed32Pedialyte Classic, mixed fruitReported as about 313 mmol/kg, above the old WHO value of 311. Rose by 41 mmol/kg after 60 days at about 31 C. | 313mOsm/kg | — | — |
| Sports drink34Powerade Mountain Blast (2016-17)Down from 391 in 2005. | 285mOsm/kg | — | — |
| WHO/UNICEF reduced-osmolarity ORS (specification)22A formulation specification, not a measurement: Na 75, Cl 65, glucose 75, K 20, citrate 10 mmol/L. It replaced an ORS of 311 mOsm/L with 90 mEq/L sodium. | 245mOsm/L | — | — |
| Oral rehydration solution, premixed, amino-acid based32enterade AD ORS, orangeThe only premixed product inside the 200-260 mmol/kg target, before and after hot storage. | 211mOsm/kg | — | — |
| Oral rehydration solution, powder made up per instructions32Dioralyte Relief (rice-based)The only powder outside 200-260 mmol/kg; the authors attribute this to poorly soluble rice powder. | 145mOsm/kg | — | — |
| 'Isotonic' drink with no carbohydrate or sugar on its label35Sample 12Sold as isotonic but strongly hypo-osmolal. Measured sodium 88 mg per 100 mL (38.4 mmol/L). | 99mOsm/kg | SD 5 | — |
| Sugar-free electrolyte drink8Test drink 'E' | 87.6mOsm/kg | SD 0.5 | — |
| Sugar-free sports drink33Powerade ZeroNa 18, K 2, Cl 19 mmol/L (measured). | 61mOsm/kg | unspecified 3 | — |
| Sugar-free sports drink33Gatorade ZeroNa 19, K 3, Cl 9 mmol/L (measured). | 49mOsm/kg | unspecified 1 | — |
The honest part
When water is still the better pick
For most of what most people do, water is the better default. A sports drink earns its sugar when the session runs long, the weather is hot, or you sweat heavily and salty - and how big that "when" is differs enormously from person to person.
Under an hour, water is enough
That is the athletic trainers' own position, not ours: water covers activity under about an hour, and it is longer sessions and hard intervals where carbohydrate and electrolytes start to earn their place. How much you need varies enormously - sweat rates across the people they measured run from 0.5 to 4.0 litres an hour, and sodium losses from 0.2 to 7.3 grams an hour. That spread is why your own number beats any rule of thumb: weigh yourself before and after a session and work it out.18
What the older guidance put numbers on
The 1996 ACSM stand recommended 30 to 60 g of carbohydrate an hour from a 4 to 8% drink, with 0.5 to 0.7 g of sodium per litre, for intense exercise lasting more than an hour. The 2007 stand that replaced it aims mainly at keeping fluid losses under 2% of body weight and tells you to build the plan around your own sweat rate. A standard sports drink sits inside that carbohydrate range and at the bottom of the sodium one.19,20
If you are watching sugar
A 20 fl oz Gatorade carries 34 g of sugar and 140 calories - about 20 g per 12 fl oz, a little over half what the same volume of Coca-Cola carries at 39 g. The zero-sugar version keeps the same 270 mg of sodium per bottle and drops the sugar to nothing, which is the sensible swap if you want the electrolytes without the syrup.2,24,23
If you are on a sodium-restricted diet
One LMNT stick is 1,000 mg of sodium and one Liquid I.V. stick is 500 mg - a meaningful share of a day's sodium in a single drink, and the entire point of the product. If somebody manages your diet, check with them before you add one.25,26
If a clinician has capped your fluid
Heart failure, kidney disease and some medications come with a fluid target, and in that situation what matters is the volume going in, not what is dissolved in it. Follow the number you were given rather than anything derived from studies in healthy adults.
More is not safer
Exercise-associated hyponatraemia is blood sodium below 135 mmol/L, and it comes from drinking past your sweat losses - sports drinks included, because they are still dilute compared with blood. Among Boston Marathon runners whose blood was tested, 13% were hyponatraemic, and what predicted it was gaining weight during the race and finishing in over four hours, not what they had been drinking. Replace what you lost, not more.18,21
Sick, not sweaty?
Labels
What the labels say
Published panels for products people actually buy. These are label values for one flavour and package, not laboratory measurements, and none of the brands here had any involvement in this page.
| Product | Serving | Calories | Sugars | Protein | Sodium | Potassium |
|---|---|---|---|---|---|---|
| Gatorade2Thirst Quencher, Lemon-Lime | 1 bottle (20 fl oz, 591 mL) | 140 | 34 g | 0 g | 270 mg | 80 mg |
| Gatorade23Gatorade Zero, Glacier Cherry | 20 fl oz (591 mL) | 10 | 0 g | 0 g | 270 mg | 80 mg |
| Powerade27Mountain Berry Blast | 12 fl oz | 80 | 21 g | — | 240 mg | 80 mg |
| Liquid I.V.26Hydration Multiplier, Lemon Lime | 1 stick (16 g) mixed with 16 fl oz water | 50 | 11 g | — | 500 mg | 370 mg |
| Liquid I.V.28Hydration Multiplier Sugar-Free, Lemon Lime | 1 stick (13 g) mixed with 16 fl oz water | 20 | 0 g | — | 500 mg | 370 mg |
| Pedialyte29Classic, Mixed Fruit | 33.8 fl oz (1 L) | 70 | 13 g | — | 1,080 mg | 780 mg |
| Pedialyte30AdvancedCare Plus, Berry Frost | 33.8 fl oz (1 L) | 100 | 19 g | — | 1,380 mg | 780 mg |
| PRIME31Prime Hydration, Ice Pop | 1 bottle (16.9 fl oz, 500 mL) | 20 | 2 g | — | 30 mg | 700 mg |
| LMNT25Citrus Salt drink mix | 1 stick pack (6 g) | 5 | 0 g | 0 g | 1,000 mg | 200 mg |
Labels checked 2026-09-15. A dash means the label does not publish that value — it is not a zero. Formulations and panels change, so treat these as a snapshot and check the carton in your hand.
- Gatorade: 34 g added sugars.
- Gatorade: The gatorade.com FAQ also says a 20 oz serving has about 270 mg of sodium.
- Gatorade: Sweetened with sucralose and acesulfame potassium.
- Powerade: 21 g added sugars.
- Powerade: Magnesium and calcium are listed on the panel with no amount.
- Powerade: Only a 12 fl oz serving panel is published (2.5 servings per 28 fl oz bottle).
- Liquid I.V.: 11 g added sugars.
- Liquid I.V.: Label values are per stick; the maker recommends one stick in 16 oz of water.
- Liquid I.V.: Sweetened with allulose.
- Pedialyte: 13 g added sugars; chloride 1240 mg; zinc 7.8 mg.
- Pedialyte: About 47 mEq sodium per litre. The page's '60 mEq vs 45 mEq' footnote describes AdvancedCare Plus, not Classic.
- Pedialyte: Chloride 1770 mg; zinc 7.8 mg; dietary fibre 2 g; 19 g added sugars.
- Pedialyte: About 60 mEq sodium per litre. Contains milk ingredients (galactooligosaccharides).
- PRIME: 0 g added sugars; 10% coconut water; sweetened with sucralose and acesulfame potassium.
- PRIME: Label states 'caffeine-free' without a mg figure.
- PRIME: The bottle side reads '835mg+ electrolytes'.
- LMNT: Label says 'no sugar, no caffeine'.
- LMNT: None of the brand's pages gives a water volume per stick.
Four things the panel does not tell you
Per litre, Powerade carries more sodium than Gatorade
676 mg/L (29.4 mmol/L) against 457 mg/L (19.9 mmol/L), even though the Gatorade bottle shows the bigger number - the bottle is simply bigger. Per litre is the only way to line a 12 fl oz can up against a 20 fl oz bottle and a stick of powder.27,2
LMNT has no sodium-per-litre figure here
A stick is 1,000 mg of sodium, but none of the brand's pages says how much water to mix it into, so there is no litre to divide by.25
BodyArmor is deliberately absent
Its product pages rendered blank on every attempt, so neither the nutrition panel nor the electrolyte claim on the front could be verified. A missing row is better than a number we could not read off the label ourselves.
Nuun is in the studies above, not in this table
What a trial reports is the composition the researchers measured or were handed, which is not a current label anybody checked. Those are two different kinds of number and they do not belong in the same table.11
Read the panel, not the front
Questions
Sports drinks and hydration, question by question
Is Gatorade more hydrating than water?
Not at rest. A sports drink scored 1.02 on the beverage hydration index against water's 1.00, well inside the study's own noise, and only four of the thirteen drinks tested beat water at all: skimmed milk, an oral rehydration solution, full-fat milk and orange juice. Sports drinks earn their place in long or hot exercise, where the sodium in them helps you hold on to what you drink.1,14
Is Gatorade good for hydration if I am not exercising?
It will hydrate you: USDA puts a generic sports drink at 93.4% water. But a 20 fl oz bottle carries 34 g of sugar and 140 calories for a retention benefit that measured as nothing at rest. On the sofa, water does the same job for free.3,2,1
Does Powerade hydrate you, and is it different from Gatorade?
Powerade was the sports drink in the index trial, so it is the drink that scored 1.02. One twist: per litre, the US Powerade label works out at 676 mg of sodium against Gatorade's 457, even though the Gatorade bottle shows the bigger number, because the bottle is bigger. Both sit far below an oral rehydration solution. Formulations also change over time, so the drink tested in 2014 is not the one on the shelf today.1,27,2
Does Gatorade Zero still hydrate you?
It carries the same 270 mg of sodium per bottle with none of the sugar. No trial has measured its hydration index, so there is no number for it. What has been measured is how dilute it is: 49 mOsm/kg against 343 for regular Gatorade, which puts it closer to a diet soft drink than to a sports drink.23,2,33
Do electrolyte powders like Liquid I.V. or LMNT work better?
They are far more concentrated in sodium - about 46 mmol/L for Liquid I.V. mixed as directed, against roughly 20 for a sports drink - and sodium is what most reliably improves retention. But the tablet, powder and drop trials are small, mostly funded by the makers, and several report their results only in figures, so there is no clean number to quote. The evidence is thinner than the marketing.26,2,13,14,11,12
When does a sports drink actually earn its place?
Under about an hour, water is enough. Past that, or in heat, or in hard intervals, the carbohydrate and sodium start doing something measurable. The older guidance put it at 30 to 60 g of carbohydrate an hour from a 4 to 8% drink with 0.5 to 0.7 g of sodium per litre, which is roughly where a standard sports drink sits. Measure your own losses with the sweat rate calculator rather than trusting a rule of thumb.18,19
Can you drink too much sports drink?
Yes. Drinking past your sweat losses can push blood sodium below 135 mmol/L, and a sports drink does not protect you from that - it is still dilute compared with blood. Replace what you lost, not more.18
Receipts
Sources and how we compiled this
Where the composition comes from
U.S. Department of Agriculture, Agricultural Research Service. FoodData Central. Built 2026-09-15 from the published CSV releases, never hand-typed.
- Food and Nutrient Database for Dietary Studies (FNDDS) · 2024-10-31
- — Drinks and prepared foods use FNDDS (foods and drinks as consumed) whenever FNDDS has a code for the item.
- — Raw produce and dairy foods use Foundation Foods when the entry is current (listed in foundation_food.csv), stands for the food generally rather than one cultivar or colour, and reports water, energy and potassium, plus fiber for plant foods. Otherwise SR Legacy.
- — A Foundation pick with no household portions uses the portions of the SR Legacy entry for the same food (portionsSource).
- — Fluid milks use FNDDS, whose composition matches the Foundation analyses (crossCheck) and which has consistent drink portions.
- — SR Legacy fills any remaining gap. No proxy is used where USDA has no sensible entry (see missing).
What this evidence cannot tell you
- — The Beverage Hydration Index measures short-term retention, not 24-h hydration: for each person it is urine after still water divided by urine after the test drink, anchored 2 h after drinking 1 L over 30 min.
- — Most participants were young, healthy, euhydrated, fasted, rested men given a single 1 L dose. Older adults retain more water and respond differently.
- — Post-exercise retention percentages come from dehydrated people drinking 100-150% of the body mass they lost. They are not comparable to BHI values and must not share a scale with them.
- — Clarke 2019 reports mean ± SEM while most studies report SD, so spreads are not directly comparable.
- — No resting BHI data were found for soup, smoothie, lemonade or coconut water. Energy-drink evidence comes from one modified-protocol study, and soda evidence is cola and diet cola from Maughan 2016 only.
- — Many of these studies are industry funded: the European Hydration Institute, Entrinsic, Dairy Management, Nuun, Coca-Cola, Buoy, Lingtea, QCK, the Almond Board, 8 POiNT, VitaCoco, Liquid I.V., Innate-Essence and ITO EN all appear as funders.
- — Commercial formulations change over time. Compositions are as measured or labelled at the time of each study and are not current labels.
Who paid for the research
Hydration research is heavily industry funded. That does not make a study wrong, but you should know who paid before you weigh it. Water Goose took no money from anyone named here, and no brand saw this page before it went up.
- — Maughan 2016: Funded by a grant from the European Hydration Institute (EHI). Prof Maughan chairs the EHI Scientific Advisory Board (not the Institute itself); Dr Watson has also received EHI funding.
- — Clarke 2019: Partially funded by an unrestricted gift from Entrinsic Health Solutions.
- — Berry 2020: Funded by Dairy Management Inc.
- — Millard-Stafford 2021: Funded by Coca-Cola.
- — Yun 2022: Grants from Lingtea Co., Ltd., which makes the oral rehydration solution and one of the sports drinks tested.
- — Bechke 2022: Funded by QCK, LLC (grant 20-0081), the maker of HOIST.
- — Pence 2020: Provided in part by Nuun & Company, Inc., and the University of Memphis.
- — Boyd-Shiwarski 2025: Buoy paid for part of two authors' time.
- — Funnell 2024: One author has industry funding, including Entrinsic and past PepsiCo.
References
Every number on this page points at one of these. Product labels were checked 2026-09-15.
- 1
Maughan RJ, Watson P, Cordery PAA, Walsh NP, Oliver SJ, Dolci A, Rodriguez-Sanchez N, Galloway SDR. A randomized trial to assess the potential of different beverages to affect hydration status: development of a beverage hydration index. Am J Clin Nutr 2016;103(3):717-723.
StudyRead: full textOpen source
Funding: Funded by a grant from the European Hydration Institute (EHI). Prof Maughan chairs the EHI Scientific Advisory Board (not the Institute itself); Dr Watson has also received EHI funding.
Read from the LJMU green open-access accepted manuscript (https://researchonline.ljmu.ac.uk/id/eprint/12468/); the publisher page was blocked. ISRCTN13014105.
- 2
PepsiCo Product Facts. Gatorade Thirst Quencher Lemon-Lime, 20 fl oz (label embedded on gatorade.com). Label last updated 12 September 2026.
Product labelRead: official pageOpen source
Product page: https://www.gatorade.com/sports-drinks/gatorade-thirst-quencher/lemon-lime
- 3
U.S. Department of Agriculture, Agricultural Research Service. FoodData Central (SR Legacy and Foundation Foods).
DatasetRead: official pageOpen source
Water content is not the same thing as a net hydration effect.
- 4
Sollanek KJ, Tsurumoto M, Vidyasagar S, Kenefick RW, Cheuvront SN. Neither body mass nor sex influences beverage hydration index outcomes during randomized trial when comparing 3 commercial beverages. Am J Clin Nutr 2018;107(4):544-549.
StudyRead: abstractOpen source
NCT03262597. Full text blocked; the abstract does not state the BHI time window, and drink composition is known only from later papers.
- 5
Clarke MM, Stanhewicz AE, Wolf ST, Cheuvront SN, Kenefick RW, Kenney WL. A randomized trial to assess beverage hydration index in healthy older adults. Am J Clin Nutr 2019;109(6):1640-1647.
StudyRead: full textOpen source
Funding: Partially funded by an unrestricted gift from Entrinsic Health Solutions.
NCT03559101. Data reported as mean ± SEM, not SD.
- 6
Wolf ST, Stanhewicz AE, Clarke MM, Cheuvront SN, Kenefick RW, Kenney WL. Age-related differences in water and sodium handling after commercial hydration beverage ingestion. J Appl Physiol 2019;126(4):1042-1048.
StudyRead: full textOpen source
Companion paper to Clarke 2019 (same participants). The abstract's sodium values for Pedialyte and ENT-5 are swapped relative to the Methods; the Methods values agree with Clarke 2019.
- 7
Berry CW, Wolf ST, Murray B, Kenney WL. Hydration efficacy of a milk permeate-based oral hydration solution. Nutrients 2020;12(5):1502.
StudyRead: full textOpen source
Funding: Funded by Dairy Management Inc.
- 8
Millard-Stafford M, Snow TK, Jones ML, Suh H. The beverage hydration index: influence of electrolytes, carbohydrate and protein. Nutrients 2021;13(9):2933.
StudyRead: full textOpen source
Funding: Funded by Coca-Cola.
- 9
Yun HJ, Lee JY, Jeon M, Oh SE, Park JH, Yoon J. The effects of fluid absorption and plasma volume changes in athletes following consumption of various beverages. BMC Sports Sci Med Rehabil 2022;14(1):207.
StudyRead: full textOpen source
Funding: Grants from Lingtea Co., Ltd., which makes the oral rehydration solution and one of the sports drinks tested.
- 10
Bechke EE, Zaplatosch ME, Choi JY, Adams WM. Nutrients 2022;14(6):1286.
StudyRead: full textOpen source
Funding: Funded by QCK, LLC (grant 20-0081), the maker of HOIST.
Isotonic beverage (HOIST) versus water; the full title was not recorded in the evidence file.
- 11
Pence J, Bloomer RJ. Impact of Nuun electrolyte tablets on fluid balance in active men and women. Nutrients 2020;12(10):3030.
StudyRead: full textOpen source
Funding: Provided in part by Nuun & Company, Inc., and the University of Memphis.
- 12
Boyd-Shiwarski CR, Ray EC, Subramanian H, Zharichenko N, Monroe A, Mahajan A. Nutrients 2025;17(3):585.
StudyRead: full textOpen source
Funding: Buoy paid for part of two authors' time.
Electrolyte drops vs tablets and the beverage hydration index; the full title was not recorded in the evidence file. NCT05768789. Non-randomised, fixed visit order.
- 13
Maughan RJ, Watson P, Cordery PAA, Walsh NP, Oliver SJ, Dolci A, Rodriguez-Sanchez N, Galloway SDR. Sucrose and sodium but not caffeine content influence the retention of beverages in humans under euhydrated conditions. Int J Sport Nutr Exerc Metab 2019;29(1):51-60.
StudyRead: abstractOpen source
Abstract describes a double-blind crossover design. Numeric BHI values are not in the abstract. Peden 2024 describes the sucrose result differently (only the 20% drink raising BHI).
- 14
Maughan RJ, Leiper JB. Sodium intake and post-exercise rehydration in man. Eur J Appl Physiol Occup Physiol 1995;71(4):311-319.
StudyRead: abstractOpen source
Values are mean (SEM).
- 15
Shirreffs SM, Taylor AJ, Leiper JB, Maughan RJ. Post-exercise rehydration in man: effects of volume consumed and drink sodium content. Med Sci Sports Exerc 1996;28(10):1260-1271.
StudyRead: abstractOpen source
- 16
Vist GE, Maughan RJ. The effect of osmolality and carbohydrate content on the rate of gastric emptying of liquids in man. J Physiol 1995;486(Pt 2):523-531.
StudyRead: abstractOpen source
Values are mean ± SEM.
- 17
Clayton DJ, Evans GH, James LJ. Effect of drink carbohydrate content on postexercise gastric emptying, rehydration, and the calculation of net fluid balance. Int J Sport Nutr Exerc Metab 2014;24(1):79-89.
StudyRead: abstractOpen source
- 18
McDermott BP, Anderson SA, Armstrong LE, et al. National Athletic Trainers' Association Position Statement: Fluid Replacement for the Physically Active. J Athl Train 2017;52(9):877-895.
GuidelineRead: full textOpen source
- 19
Convertino VA, Armstrong LE, Coyle EF, et al. American College of Sports Medicine position stand. Exercise and fluid replacement. Med Sci Sports Exerc 1996;28(1):i-vii.
GuidelineRead: abstractOpen source
Superseded by the 2007 position stand.
- 20
American College of Sports Medicine; Sawka MN, Burke LM, Eichner ER, Maughan RJ, Montain SJ, Stachenfeld NS. Exercise and fluid replacement. Med Sci Sports Exerc 2007;39(2):377-390.
GuidelineRead: abstractOpen source
- 21
Almond CS, Shin AY, Fortescue EB, et al. Hyponatremia among runners in the Boston Marathon. N Engl J Med 2005;352(15):1550-1556.
StudyRead: abstractOpen source
- 22
WHO/UNICEF. Oral rehydration salts: production of the new ORS. WHO/FCH/CAH/06.1. Geneva: World Health Organization; 2006.
GuidelineRead: full textOpen source
Read from a GiveWell-hosted copy of the document.
- 23
PepsiCo Product Facts. Gatorade Zero Glacier Cherry, 20 fl oz (label embedded on gatorade.com).
Product labelRead: official pageOpen source
Product page: https://www.gatorade.com/sports-drinks/gatorade-zero/glacier-cherry
- 24
Coca-Cola US. Coca-Cola Original product page, nutrition facts and FAQ.
Product labelRead: official pageOpen source
The only 12 fl oz panel on this page belongs to Coca-Cola Caffeine Free; 12 oz figures for Original come from the page FAQ.
- 25
LMNT. Citrus Salt drink mix, label image and product page.
Product labelRead: official pageOpen source
- 26
Liquid I.V. Hydration Multiplier Lemon Lime, product label image.
Product labelRead: official pageOpen source
Use the flavour-specific label, not the generic 'Nutrition Facts Panel' image the same page embeds.
- 27
Powerade (Coca-Cola). Powerade Mountain Berry Blast nutrition facts.
Product labelRead: official pageOpen source
- 28
Liquid I.V. Hydration Multiplier Sugar-Free Lemon Lime, product label image.
Product labelRead: official pageOpen source
- 29
Pedialyte (Abbott). Pedialyte Classic Mixed Fruit, 1 L nutrition information.
Product labelRead: official pageOpen source
The '60 mEq vs 45 mEq' footnote on this page describes AdvancedCare Plus, not Classic.
- 30
Pedialyte (Abbott). Pedialyte AdvancedCare Plus Berry Frost, 1 L nutrition information.
Product labelRead: official pageOpen source
- 31
PRIME. Prime Hydration Ice Pop, 16.9 fl oz, back-of-bottle label image.
Product labelRead: official pageOpen source
Label photo is of the limited-edition bottle design.
- 32
Sollanek KJ, Kenefick RW, Cheuvront SN. Osmolality of Commercially Available Oral Rehydration Solutions: Impact of Brand, Storage Time, and Temperature. Nutrients 2019;11(7):1485.
StudyRead: full textOpen source
- 33
Funnell MP, Juett LA, Reynolds KM, et al. Iterative assessment of a sports rehydration beverage containing a novel amino acid formula on water uptake kinetics. Eur J Nutr 2024;63(4):1125-1137.
StudyRead: full textOpen source
Funding: One author has industry funding, including Entrinsic and past PepsiCo.
- 34
Mettler S, Weibel E. Osmolality, pH, and titratable acidity of sports drinks on the Swiss market. SEMS Journal 2018.
StudyRead: full textOpen source
Survey October 2016 to January 2017. Per-product tables are images; only values quoted in the Discussion are used.
- 35
Skarlovnik T, Lamut A, Hostnik G, Gole B, Bren U. Osmolality and Tonicity of Isotonic Beverages. Foods 2024;13(10):1483.
StudyRead: full textOpen source
The EFSA 270-330 mOsm/kg isotonic criterion is as cited by the authors (EFSA Journal 2011;9(6):2211, not opened).
- 36
Sadowska A, Świderski F, Rakowska R, Waszkiewicz-Robak B, Żebrowska-Krasuska M, Dybkowska E. Beverage osmolality as a marker for maintaining appropriate body hydration. Rocz Panstw Zakl Hig 2017;68(2):167-173.
StudyRead: full textOpen source
Polish market products. This is the source of the 275-295 mOsm/kg range (it describes the isotonic drinks tested), not Maughan 2016.
- 37
EFSA Panel on Dietetic Products, Nutrition, and Allergies (NDA). Scientific Opinion on Dietary Reference Values for water. EFSA Journal 2010;8(3):1459.
GuidelineRead: full textOpen source
Read from the DTU Orbit copy of the published PDF; Wiley was blocked.
- 38
Institute of Medicine. Dietary Reference Intakes for Water, Potassium, Sodium, Chloride, and Sulfate. Chapter 4: Water. Washington, DC: The National Academies Press; 2005.
GuidelineRead: full textOpen source
Cite this directly for adequate intakes: Maughan 2016's introduction misstates the women's figure. On alcohol it concludes the diuresis is transient; it makes no explicit 'all drinks count equally' statement.
Other drinks, measured
- Every drink, measured against waterThe whole index in one chart, with the composition of all 23 drinks underneath.
- Does milk hydrate you?The drink that kept its advantage after the water-content correction.
- Does orange juice hydrate you?Sugar without the sodium, and what that does to the numbers.
- Does soda hydrate you?Cola and diet cola on the same index, with the caffeine and sugar per can.
Free tools
- Sweat rate calculatorWeigh in, train, weigh out. Get your litres-per-hour, your fluid deficit, and how much to drink per hour next time.
- Hiking water calculatorHours, heat, pack weight and climb, turned into litres to carry — and what that weighs on your back.
- Water intake calculatorYour daily target from weight, activity, climate and altitude — shown in ounces, millilitres, litres, cups and bottles at once.
This page describes what studies measured in healthy adults. It is general wellness information, not medical advice, diagnosis or treatment. Fluid needs change with health conditions, medication and pregnancy — and some conditions require drinking less. Talk to a clinician about yours.
Keep the number
A bottle of Gatorade on the counter is not the same as a bottle you finished, and by hour three of a hot day you will not remember which it was. Water Goose counts them as you drink them.
Free on iPhone and Android. Water Goose Plus unlocks saving and customising.